ARTÍCULO DE REVISIÓN
Diego Alejandro Espíndola-Fernández1, Ana María Posada-Cano2, Dagnóvar Aristizábal-Ocampo2, Jaime Gallo-Villegas1,2
School of Medicine, University of Antioquia
SICOR Clinical and Research Center for Comprehensive Solutions in Cardiovascular Risk
Recibido:
de marzo de 2024
Aceptado:
de marzo de 2024
Correspondencia:
DOI: 10.56050/01205498.2339
Abstract
Introduction: Studies related to the mechanisms of senescence have allowed the identification and quantification of biomarkers of biological aging. However, the available information is scattered, and there is no uniform definition of the concept. We aimed to overview the current approaches to measuring biological age using biomarkers and summarize the evidence. Méthods: We use the five-phase methodology developed by Arksey and O’Malley. A comprehensive search was performed in five databases up to March 27, 2023. Original articles that described methods for measuring biological age using ≥2 biomarkers in individuals aged ≥18 years were included, with no restrictions on language or publication date. Results: We included 90 articles from 15 countries that were published as early as 1974. Most were observational, utilizing biomarkers ranging from 3 to 900. Eleven methods for calculating composite biological age were described: principal component analysis, Klemera-Doubal, and multiple linear regression analysis being the most used. The outcomes focused on specific risk factors, comorbidities, physical or cognitive functionality, and mortality. The prognostic validity of biological age was as- sessed by examining its association with mortality risk, highlighting its superior predictive power compared to chronological age or traditional age-related disease biomarkers. Conclusion: We conclude that scientific literature exhibits considerable heterogeneity in number and type of biomarkers employed, as well as the methods used to estimate biological age. Currently, there is no universally accepted standard for assessing biological age, and there is lack of research examining its reproducibility and prognostic validity.
Keywords: Biological age; Chronic noncommunicable diseases; Aging; Biomarker; Systematic review
Resumen
Introducción: Los estudios relacionados con los mecanismos del envejecimiento han permitido la identificación y cuantificación de biomarcadores del envejecimiento biológico. Sin embargo, la información disponible está dispersa y no existe una definición uniforme del concepto. Nuestro objetivo fue revisar los enfoques actuales para medir la edad biológica utilizando biomarcadores y resumir la evidencia. Métodos: Utilizamos la metodología de cinco fases desarrollada por Arksey y O’Malley. Se realizó una búsqueda exhaustiva en cinco bases de datos hasta el 27 de marzo de 2023. Se incluyeron artículos originales que describían métodos para medir la edad biológica utilizando ≥2 biomarcadores en individuos mayores de ≥18 años, sin restricciones de idioma o fecha de publicación. Resultados: Se incluyeron 90 artículos de 15 países, publicándose el primero en 1974. La mayoría fueron observacionales, utilizando desde 3 hasta 900 biomarcadores. Se describieron once métodos para calcular la edad biológica compuesta: el análisis de componentes principales, Klemera-Doubal y el análisis de regresión lineal múltiple, fueron los más utilizados. Los resultados se centraron en factores de riesgo específicos, comorbilidades, funcionalidad física o cognitiva y mortalidad. La validez pronóstica de la edad biológica se evaluó examinando su asociación con el riesgo de mortalidad, destacando su poder predictivo superior en comparación con la edad cronológica o los biomarcadores de enfermedades tradicionales relacionadas con la edad. Conclusión: Concluimos que la literatura científica exhibe una considerable heterogeneidad en el número y tipo de biomarcadores empleados, así como en los métodos utilizados para estimar la edad biológica. Actualmente, no existe un estándar universalmente aceptado para evaluar la edad biológica, y falta investigación que examine su reproducibilidad y validez pronóstica.
Palabras clave: Edad biológica; Enfermedades crónicas; Longevidad; Biomarcadores; Revisión sistemática, envejecimiento.
Introduction
Aging is a multidimensional phenomenon, and chronological age is just one of its relevant dimensions (1). Conventional measures of aging tend to overlook other important aspects, such as health and physiological function (2). With the improvement of health services, medical advancements, and technological progress, the population pyramid is being inverted, with adults over 65 years of age now comprising 10% of the global population (3). This shift can be attributed to increased life expectancy, which has consequently resulted in a higher prevalence of frailty, disability, and chronic noncommunicable diseases associated with age-related physiological decline (4). Consequently, there has been a growing need for research focused on understanding and quantifying the ageing process (5).
Studies exploring the mechanisms of ageing have identified and measured early markers of biological decay, offering valuable insights for the development of preventive and therapeutic strategies (6). These markers encompass various indicators of advancing age, including: i) external physical manifestations of aging (7); ii) morphological and physiological modifications of different organs (8); iii) neuropsychological changes (9); iv) physical work capacity (10); and v) biochemical and clinical markers (11). It is worth noting that there are additional measurements, such as frailty indices, deficit accumulation scores, multimorbidity scores, multifactorial risk indices, and prognostic indices, which are beyond the scope of this work (11). These biomarkers serve as composite measures of the senescence process, which often occurs asynchronously with chronological age.
In the scientific literature, different methods of quantifying biological age have been described. These methods range from composite estimates that include multiple biomarkers pointing at measurable and quantifiable biological parameters, serving as indices for assessing health and physiology (12). However, the information on this topic is dispersed throughout the literature (13), lacking a unified definition of biological age (14) and a consensus on the optimal biomarkers to be included (15). Moreover, methodologies for assessing biological age have evolved over time (16), yet there is a surprising lack of validation studies supporting their use (17). Therefore, the objective of this scoping review is to provide a comprehensive characterization of the measurement of biological age using multiple biomarkers in the general population, including the methods employed, the selection of biomarkers, the types of research designs utilized, and the validation of the estimates. By identifying gaps in the existing literature, this review also offers suggestions for future research priorities in this field.
Methods
This scoping review was conducted following the five-phase methodology developed by Arksey and O’Malley (18). Unlike a systematic review, a scoping review is employed to explore relatively new or emerging concepts, aiming to identify the breadth of evidence, key concepts, and core factors related to the topic, while also highlighting knowledge gaps and suggesting future research directions (19). The findings of this study are presented in accordance with the Preferred Reporting Items for Systematic Reviews and Meta-Analyses (PRISMA) guidelines, specifically the extension for scoping reviews (PRISMA-ScR), which includes a checklist and explanation (20). It should be noted that this systematic review did not have a pre-registered protocol.
The research question for this study was formulated using the Population, Intervention, Comparison, and Outcome (PICO) framework, aiming to identify composite biomarker predictors of biological age in the general population. Thus, the research question of this study was: “What is the existing knowledge on the measurement of biological age using multiple biomarkers in the general population?” This scoping review included observational studies, clinical trials, sys- tematic reviews, and meta-analyses involving individuals aged 18 years and older, without restrictions on previous medical history or associated conditions. However, studies specifically focused on a particular medical condition were excluded.
A systematic three-step search strategy was implemented to identify relevant literature published up to March 27, 2023. Firstly, the PubMed database was searched using key terms and MeSH terms such as “biological age,” “biological aging,” “measure,” and “biomarker.” Secondly, five databases including PubMed, CINAHL, Embase, SCOPUS, and Cochrane Central were searched for relevant published articles. There were no restrictions on publication date or language. The search terms used in this step included “biological age,” “biological aging,” “measure,” “quantification,” “evaluation,” “assessment,” “estimation,” and “biomarker.”
For each database, specific search parameters were applied, including keywords and specifiers for time, language, and types of study. The search strategies used for each database are as follows:
PubMed: ((biological age[Title/Abstract] OR biological aging[Title/Abstract]) AND ((measure[Title/Abstract] OR quantification[Title/ Abstract] OR evaluation[Title/Abstract] OR as- sessment[Title/Abstract]) OR (biomarker[Title/ Abstract]))).
CINAHL: ((AB(biological age OR biological aging)) AND (AB((measure OR quantification OR evaluation OR assessment OR estimation) OR (biomarker)))).
Embase: (‘biological age’:ab,ti OR ‘biological aging’:ab,ti) AND (measure:ab,ti OR quantification:ab,ti OR evaluation:ab,ti OR assessment:ab,- ti OR estimation:ab,ti OR biomarker:ab,ti) AND ([systematic review]/lim OR [meta analysis]/lim OR [randomized controlled trial]/lim OR [controlled clinical trial]/lim) AND [1900-2021]/py.
SCOPUS: ((TITLE(biological AND age) OR TITLE (biological AND aging)) AND ((TITLE-ABS (measure) OR TITLE-ABS (quantification) OR TITLE-ABS (evaluation) OR TITLE-ABS (assessment) OR TITLE-ABS (estimation) OR (TITLE-ABS (biomarker))))) AND (LIMIT-TO (DOCTYPE, “ar”)).
Cochrane Library: ((biological age): ti OR (biological aging): ti) AND (((measure): ti, ab, kw OR (quantification): ti, ab, kw OR (evaluation): ti, ab, kw OR (assessment): ti, ab, kw) OR (estimation): ti, ab, kw) OR (biomarker): ti, ab, kw).
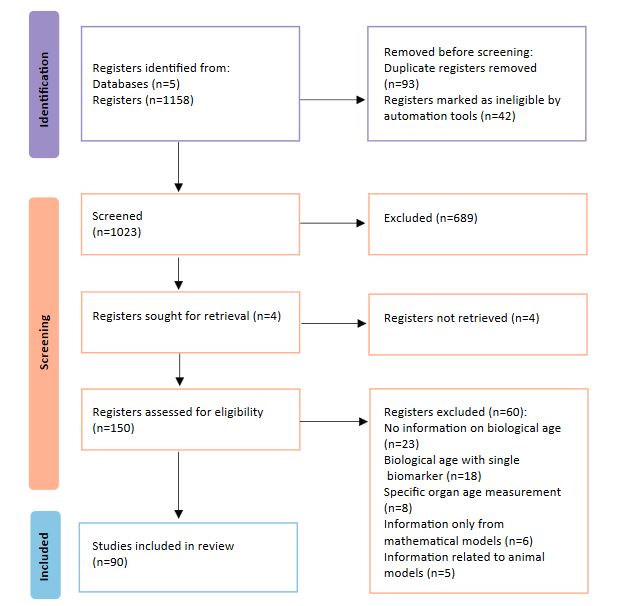
Furthermore, additional articles were identified by manually searching the reference lists of the included studies. Please refer to Figure 1 for more details.
Studies meeting the following criteria were included in the review: i) described the measurement of biological age using more than two clinical or paraclinical variables; ii) involved subjects older than 18 years, with or without previous medical history; iii) classified as observational studies, clinical trials, systematic reviews, or meta-analyses. Studies were excluded if they: i) described measurements not related to biological age or described a single marker; ii) did not refer to the direct assessment of biological age; iii) referred only to organ measurements instead of general measurements; and iv) were specifically related to the prognosis of a single condition.
To record the data, electronic databases from the Google system were accessed and the search results were reviewed. One researcher (DAEF) filled out the data extraction forms based on the predefined inclusion criteria. The extracted information was then reviewed by a second researcher (AMPC) to identify any inconsistencies. Any discrepancies or disagreements were resolved through discussion and consensus between the two researchers.
The following information was collected from each of the included articles: i) article title; ii) Digital Object Identifier (DOI); iii) year of publication; iv) name of the main author; v) language of publication; vi) country and affiliation of the main author; vii) type of methodological design viii); description of data collection; ix) stated main objective; x) mathematical or standardized method used to estimate biological age; xi) number of patients included; xii) general characteristics of the population; xiii) average age of participants; xiv) percentage of women included; xv) average biological age; xvi) for clinical trials, the type of intervention performed and its respective comparison; xvii) validity criteria of the estimation method; xviii) evaluation of reproducibility xix); number and type of biomarkers used to estimate composite biological age; xx) expected outcome; xxi) main findings reported; and xxii) relevant comments raised by the researcher.
Figure 1. A PRISMA flow chart of study selection process in the scoping review.
The studies were categorized based on the search engine and year of publication to extract the relevant information. They were further grouped according to the type of study design and the mathematical or standardized method employed to estimate biological age. Information from each article was then extracted and recorded in the designated database, following the predefined characteristics.
Results
A total of 15 nationalities were represented in the articles found, spanning from 1974 to the present. The first article originated from Finland (n=1; 1%) (21), while others were from Germany (n=4; 5%) (22–25), Australia (n=1; 1%) (26), Canada (n=3; 3%) (27–29), China (n=13; 15%) (30–42), Korea (n=10; 11%) (43–52), United States (n=24; 26%) (53–75), England (n=3; 3%) (76–78), Japan (n=8; 9%) (79–86), Poland (n=1; 1%) (87), Czech Republic (n=2; 2%) (88,89), Russia (n=11; 12%) (88,90–99), Singapore (n=2; 2%) (100,101) Switzerland (n=1; 1%) (102), Ukraine (n=1, 1%) (103), Italy (n=3; 3%) (104–106), Taiwan (n=1; 1%) (107), Denmark (n=1; 1%) (108), Israel (n=1; 1%) (109), and Mexico (n=1; 1%) (110).
Authors with multiple publications included Nakamura, E. (n=6) 59–62,64,65), Belsky, D.W. (n=4) (41,44,45,57), Jee, H. (n=3) (26,29,31), Zhang, W.G. (n=3) (13–15), Pyrkov, T.V. (n=2) (73,74), Bae, C. (n=3) (23,27,32), Liu, Z. (n=2) (17,50), and Graf, G.H. (n=2) (52,55) Most articles were published in English (n=84; 93%) (21,25–59,61–83, 85–89, 93, 94, 96, 98–101, 103–115), while a few were in Russian (n=5; 6%) (90–92, 95, 97), German (n=1; 1%) (116), and Japanese (n=1; 1%) (84). In terms of study type, one nonrandomized clinical trial was found (n=1; 1%) (102), along with 12 prospective cohort observational studies (n=12; 13%) (29, 37, 38, 55, 70, 73, 75, 76, 78, 89, 103, 107), 45 observational retrospective cohort studies (n=46; 50%) (25, 27, 28, 31, 36, 40–45, 49, 51–54, 56–59, 61–69, 71, 72, 74, 77, 80–82, 93, 94, 100, 101, 106, 109–112), and 33 cross-sectional observational studies (n=33; 37%) (21, 26, 32–35, 39, 46–48, 50, 79, 83–88, 90–92, 95–99, 104, 105, 108, 113–116). The most frequently used methods to calculate biological age were principal component analysis (PCA) (n=25; 28%) (26, 28, 34, 35, 39, 44–52, 56, 79–82, 85, 86, 93, 94, 101, 108, 113), the Klemera-Doubal method (KDM) (117) (n=32; 36%) (25, 36, 37, 39, 42, 46, 48, 49, 54–57, 59, 61, 62, 64, 65, 67–69, 72–75, 77, 78, 88, 89, 100, 101, 109, 118), multiple linear regression analysis (MLRA) (n=22; 25%) (21, 23, 24, 30–32, 39, 46–49, 51, 76, 83, 84, 87, 94, 101, 103, 104, 111, 115), the Levine method (119) (n=6, 7%) (53,66–69,77), the formula of Voitenko, V. (120) (n=4; 4%) (90,92,97,99), the BioAge scale (121) (n=4; 4%) (29,92,98,107), the formula of Belozerova, L. (122) (n=2; 2%) (90,96), functional biological age (fBioAge) (123) (n=1; 1%) (63), Hochschild method (115) (n=1; 1%) (48), Podkolzin, A. (124) (n=1; 1%) (95), machine learning (n=2; 2%) (36,40), deep neural network (n=2; 2%) (105,106), and novel methods (n=13; 15%) with specific recommendations without specifying the mathematical procedure performed (31, 33, 38, 43, 51, 58, 66, 75, 87, 94, 101–103, 110, 112).
The highest number of biomarkers applied in an article was 900, including genomic, proteomic, and metabolomic measures (56), while the lowest number was 3, encompassing strength, memory, and vibrotactile sensitivity (103). On average, 28 features were included, with a median of 9 and a mode of 9 biomarkers.
The developed methods incorporated a wide range of biomarkers based on the expected outcome, and most studies demonstrated significant variation in aging estimates. The variables included in these methods encompassed various individual characteristics, such as the presence of gray hair, baldness, and cutaneous elasticity (76), personal history of smoking or chronic noncommunicable diseases (94,100), anthropometric measures such as weight, height, and body mass index (21,33,3 8,42,52,87,90,96,101,109,110,113), vital signs like blood pressure and heart rate, hematological, metabolic, renal, inflammatory, and infectious parameters (23, 25, 27–29, 32, 34–36, 39, 41, 43, 45–47, 49–51, 53–55, 57–59, 61, 62, 64–67, 69, 72–75, 77–85, 88, 90–92, 96, 98, 100, 101, 105–107, 120), molecular tests such as telomere length and methylation (33, 71), neuromuscular capacity including grip strength, gait speed, and monopodal balance (23, 26, 28, 37, 48, 51, 78, 86, 100, 101, 103, 104, 112, 118), musculoskeletal characteristics like muscle mass and bone mineral density, lung capacity assessed through forced expiratory volume, forced vital capacity, and maximum oxygen consumption (26, 38, 39, 42, 46, 47, 49–51, 57–59, 61–63, 65, 73, 74, 78, 80–82, 88, 89, 101, 108, 115, 118), cardiovascular and arterial characteristics such as pulse pressure, intima media thickness, and ankle-brachial index (27, 32–35, 43, 92), basic neuropsychological tests including minimental, verbal memory, and semantic fluency (23, 48, 100, 101, 103, 115, 118), basic neurological sensitivity assessed with visual and auditory acuity (26, 28, 83, 85, 98, 112, 114), and self-reports such as perceived health and perception of vision or hearing (54, 63, 90, 98). These variables collectively contributed to estimating biological age in different studies.
The studies included a considerable number of participants, with an average of 173,467 patients. The minimum number of participants in a study was 15 (104), while the maximum number reached 6,518,532 (43). On average, the percentage of women included in the studies was 45%. The participants consisted of healthy adults, volunteers, or frequent visitors to community health centers where the research was conducted. The reported mean age varied across studies, with an average reported mean age of 48 years. The minimum age reported was 18 (34, 55, 68, 92–94, 113), while the maximum age reached up to the tenth decade of life (67). Participants were often described as healthy adult volunteers or individuals from retrospective and prospective cohorts of longitudinal studies.
The research objectives of the included studies were diverse but primarily focused on examining the association between biological age and measured biomarkers (30, 32, 47, 54, 60, 78, 82, 88, 90), risk factors (40, 43, 51, 81, 100, 101, 107), comorbidities (44, 52, 53, 56, 57, 86, 93, 118), physical functionality (43, 54, 61, 65, 72, 79, 87), and mortality (25, 31, 36–38, 41, 42, 44, 45, 53, 54, 67, 70–72, 74, 76, 93, 94, 109, 110).
In most articles, biological age was not specified as an absolute value or compared with chronological age. Instead, it was analyzed in relation to different outcomes based on the authors’ preferences, although the reasons for their choices were not explicitly stated.
Prognostic validity was assessed in 21 studies that considered mortality as an outcome. These studies found that a higher biological age was associated with an increased risk of mortality, particularly for all-cause mortality (25, 31, 36–38, 41, 42, 44, 45, 53, 54, 67, 70–72, 74, 76, 93, 94, 109, 110).
This association remained significant even after adjusting for sex and chronological age (31). The use of biological age showed a stronger association with mortality compared to chronological age or traditional biomarkers of age-related diseases (25, 31, 36–38, 41, 42, 44, 45, 53, 54, 67, 70–72, 74, 76, 93, 94, 109, 110).
Regarding internal validity, only one study out of the 89 included articles specifically analyzed it (57). This study compared a biological age algorithm using nine versus ten biomarkers and found similar results for risk ratios and model performance (57). Reproducibility analysis was not reported in any of the studies.
Some specific findings from the included studies were as follows: biological age was found to increase with tobacco or alcohol consumption habits (43,107). It also increased with sedentary lifestyle or low fruit intake (100), while greater physical activity (79) or participation in wellness programs were associated with decreased biological age (56). Biological age was related to impaired cognitive ability (53), fragility (101), all-cause morbidity
fatty acids, acylcarnitine, sphingolipids, and nucleotides were frequently associated with the rate of biological aging (55). Furthermore, 481 genes were identified to be significantly associated with biological age (59). Measures of biological age were found to predict physical, cognitive, and mortality outcomes, although the performance of different methods varied depending on the specific study (54, 101). Among the interventions described, double filtration plasmapheresis was found to reduce biomarkers of aging (30).
It is important to note that these findings are based on the available literature and should be interpreted in the context of each study’s design and methodology.
Discussion
In this scoping review, the focus was on the measurement of biological age using composite biomarkers. A total of 90 relevant original articles were identified, and various methods were employed for estimating biological age, with PCA being the most frequently applied method, followed by KDM and MLRA. The median number of biomarkers to estimate biological age was 9. These biomarkers encompassed a wide range of variables, including personal traits, anthropometric measurements, laboratory tests, neuromuscular, musculoskeletal, neuropsychological, pulmonary, cardiovascular characteristics, as well as tissue, cell, or molecular features (Figure 2).
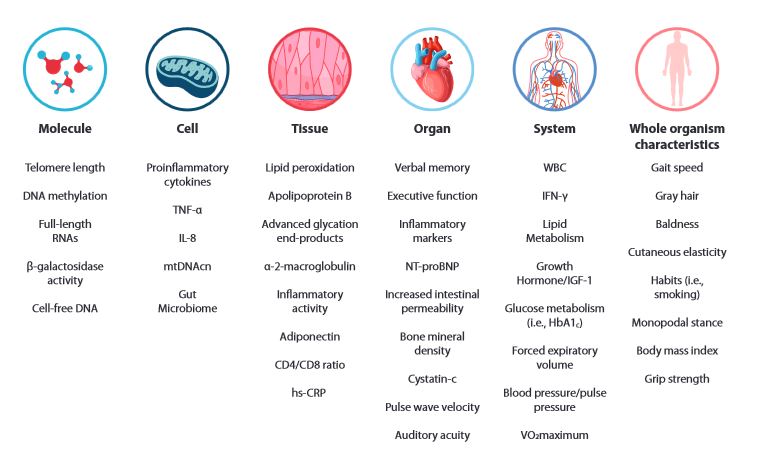
Figure 2. Range of biomarker employed in composite measures of biological age. Features are grouped in six categories and the list is non exhaustive but illustrative, indicating areas of biological functioning where these biomarkers are indicative of physiological reserve or evidence damage to cellular functions. TNF-α: Tumor Necrosis Factor-α; IL-8: Interleukin 8; mtDNAcn: mitochondrial DNA copy number; hs-CRP: high-sensitivity C-reactive protein; NT-proBNP: N-terminal (NT)-pro hormone BNP; WBC: White blood cells; IFN-γ: Interferon gamma; VO2maximum: maximum oxygen consumption.
The concept of biological age has gained recognition in aging research as a means to capture the heterogeneous and progressive decline in biological functions associated with chronological age (125). It is understood that individuals age at different rates, and biological age has been proposed as a crucial factor in explaining the variations in longevity among people (14). The findings of this scoping review highlight the importance of assessing biological age as part of the analysis of population longevity to predict adverse health outcomes (16). It has been observed that a higher biological age, compared to chronological age or traditional biomarkers of age-related diseases, is associated with an increased risk of mortality (25, 31, 36–38, 41, 42, 44, 45, 53, 54, 67, 70–72, 74, 76, 93, 94, 109, 110). Moreover, a faster rate of biological aging is linked to a worse health prognosis, characterized by greater morbidity and mortality (31, 44, 45, 53, 54, 67, 76, 93, 94).
These findings underscore the significance of considering biological age in understanding the aging process and its implications for health. By incorporating composite biomarkers and employing various predictive methods, researchers can gain insights into individual differences in aging and identify individuals at higher risk for adverse health outcomes (16).
In the management of chronic noncommunicable diseases, the use of biological age can help identify individuals who require greater healthcare interventions or who have a fragile health condition (15). This point is well supported by evidence, as observed in the results of the scoping review (Table 1). However, there are still important questions that need to be addressed regarding the assessment of biological age, including the number of biomarkers needed and the best method for its estimation. In our review, we found that the number of biomarkers considered varied widely, ranging from 3 to 900 in different studies (56,103).
These findings highlight three central questions in this field: i) What is the optimal number of biomarkers required to reliably identify a higher biological age? ii) Which composite biomarkers provide greater accuracy and precision in estimating biological age? iii) Which method yields greater validity in assessing biological age?
Among the studies included in our review, commonly employed biomarkers encompassed hematological, inflammatory, renal, metabolic, pulmonary, and cardiovascular assessments. The number of biomarkers considered varied depending on the method used and the desired outcomes. It appears that different measurements of biological age capture heterogeneous aspects of the aging process, contributing to the heterogeneity of results. Therefore, the performance of a specific calculation method cannot be automatically extrapolated to another method that employs a different set of biomarkers or outcomes.
Blood-related biomarkers frequently exhibit changes with chronological age (23, 27, 28, 32, 34, 35, 43, 45–47, 49–51, 53–55, 57–59, 61, 62, 64–67, 69, 77, 79–85, 88, 90–92, 96, 98, 100, 101, 120). However, it is important to note that these variations are often non-linear over time (126). Consequently, in the studies evaluated, it becomes challenging to separate the biochemical changes associated with age from the results obtained through cross-sectional methods used for estimating biological age.
In summary, while biological age shows promise in identifying individuals with greater healthcare needs and fragility, there is a need for further research to determine the optimal number of biomarkers, identify the most accurate composite biomarkers, and establish the most valid method for assessing biological age. This will contribute to the refinement and standardization of biological age estimation, ultimately enhancing its utility in the management of chronic noncommunicable diseases.
Table 1. Description of the studies included in the scoping review.
C: Cross-sectional; RC: Retrospective cohort; PC: Prospective cohort; CCT: Controlled clinical trial; MLRA: Multiple linear regression analysis; PCA: Principal component analysis; KDM: Kle- mera-Doubal method; LM: Levine method; SEM: Structural equation model.
|
Author |
Ref. |
Year |
Nationality |
Type of study |
Biological age estimation method |
Number of subjects |
Age |
Women |
Biomarkers |
Outcomes |
|
|
1 |
Heikkinen, E. |
(21) |
1974 |
Finland |
C |
MLRA |
460 |
25 to 57 years |
0% |
6: neurological sensitivity, neuropsychological tests, lung capacity. |
Biological age measurement. |
|
2 |
Nakamura, E. |
(84) |
1982 |
Japan |
C |
MLRA |
390 |
30 to 76 years |
0% |
9: blood labs, cardiovascular characteristics, neurological sensitivity, lung capacity, vital signs. |
Biological age measurement. |
|
3 |
Takeda, H. |
(83) |
1982 |
Japan |
C |
MLRA |
200 |
20 to 69 years |
0% |
6: neurological sensitivity, lung capacity, vital signs, blood labs. |
Relevance of biological age measurement in health screening. |
|
4 |
Dubina, T.L. |
(103) |
1984 |
Ukraine |
PC |
Multiple regression equation that is a statistical relationship between age and the three parameters measured in the population under study. |
250 |
60 to 100 years |
38.0% |
3: neuromuscular capacity, neuropsychological tests, neurological sensitivity. |
Relation of biological age measurement and MLRA. |
|
5 |
Nakamura, E. |
(85) |
1988 |
Japan |
C |
PCA |
462 |
50.8 ± 12.1 years |
0% |
11: blood labs, neurological sensitivity, vital signs, lung capacity. |
Biological age measurement. |
|
6 |
Hochschild, R. |
(60) |
1989 |
United States |
C |
MLRA |
2462 |
Men: 45.9 years
Women: 44.7 years |
60.0% |
12: neurological sensitivity, neuropsychological tests, lung capacity. |
Relationship of biological, chronological age and biomarkers. |
|
7 |
Nakamura, E. |
(79) |
1990 |
Japan |
C |
PCA |
65 |
42.1 ± 8.1 years |
100% |
9: lung capacity, vital signs, blood labs, cardiovascular characteristics. |
Compare biological age and physical fitness. |
|
8 |
Lee, M.S. |
(86) |
1996 |
Japan |
C |
PCA |
322 |
49.5 ± 14.3 years |
0% |
1 method, 4 biomarkers: lung capacity, neuromuscular capacity, musculoskeletal characteristics; 2 method, 3 biomarkers: neuromuscular capacity. |
Compare both methods and ischemic heart disease, hypertension, obesity or diabetes. |
|
9 |
Anstey, K.J. |
(26) |
1999 |
Australia |
C |
PCA |
180 |
70.6 ± 7.1 years |
100% |
5: neurological sensitivity, neuromuscular capacity, lung capacity. |
Relation with cognitive performance. |
|
10 |
Martin, H. |
(24) |
2002 |
Germany |
C |
MLRA |
404 |
Specified by decade and gender |
50.0% |
13: blood labs |
Biological age measurement. |
|
11 |
Nakamura, E. |
(82) |
2003 |
Japan |
RC |
PCA |
86 |
51.2 years |
0% |
9: lung capacity, vital signs, blood labs. |
Relation of Biological age and biomarkers. |
|
12 |
MacDonal, S.W.S. |
(28) |
2004 |
Canada |
RC |
PCA |
125 |
67 to 80 years: 75.9 ± 2.9 years; 81 to 95 years: 84.3 ± 3.5 years |
62.0% |
6: neurological sensitivity, neuromuscular capacity, lung capacity, anthropometric measures, vital signs. |
Cognitive changes at 12 years. |
|
Author |
Ref. |
Year |
Nationality |
Type of study |
Biological age estimation method |
Number of subjects |
Age |
Women |
Biomarkers |
Outcomes |
|
|
13 |
Goggins, W.B. |
(31) |
2005 |
China |
RC |
Inverse regression of the square root of age on the square root of the mean frailty and sex to calculate a biological age corresponding to a particular sex and a frailty index value. |
2032 |
79.7 years |
51.0% |
62 clinical history markers: physical, psychological, and socioeconomic. |
Relation of biological age and mortality. |
|
14 |
Nakamura, E. |
(81) |
2007 |
Japan |
RC |
PCA |
86 |
54.1 ± 12.1 years |
0% |
5: lung capacity, vital signs, blood labs. |
Factors related to biological age. |
|
15 |
Mrázová, R. |
(88) |
2007 |
Czech Republic |
C |
KDM |
55 |
33 to 54 years |
0% |
6: anthropometric measures, vital signs, lung capacity, neurological sensitivity. |
Biomarker differences between healthy and paraplegic men. |
|
16 |
Bulpitt, C.J. |
(76) |
2009 |
England |
PC |
MLRA |
397 |
47.9 ± 5.8 years |
0% |
1 equation, 7 biomarkers: individual characteristics, vital signs, blood labs. 2 equation, 8 biomarkers: individual characteristics, vital signs, blood labs. |
Mortality. |
|
17 |
Nakamura, E. |
(80) |
2009 |
Japan |
RC |
PCA |
179 |
Men: 54.1 ± 12.1 years Women: 55.3 ± 11.7 years |
52.0% |
5: lung capacity, vital signs, blood labs. |
Gender differences in biological age. |
|
18 |
Bae, C-Y. |
(47) |
2009 |
South Korea |
C |
MLRA |
3575 |
58.0 ± 8.1 years |
64.0% |
15 biomarkers: musculoskeletal characteristics, anthropometric measures, vital signs, lung capacity; blood labs. Women: additional blood labs. Men: additional blood labs. |
Examine the linear relationship between age and some biomarkers. |
|
19 |
Freude, G. |
(23) |
2009 |
Germany |
C |
MLRA |
371 |
45.6 ± 8.1 years |
61.0% |
23 not specified: vital signs, neuromuscular capacity, neurological sensitivity, neuropsychological tests. |
Compare types of work and relationship with biological age. |
|
20 |
Park, J. |
(50) |
2009 |
South Korea |
C |
PCA |
1588 |
50.0 ± 9.6 years |
0% |
11: lung capacity, musculoskeletal characteristics, anthropometric measures, vital signs, blood labs. |
To examine if some pathological conditions such as diabetes affect the biological age developed. |
|
21 |
Cho, I.H. |
(48) |
2010 |
South Korea |
C |
5 methods: (i) MLRA, (ii) PCA and somewhat unique methods developed by (iii) Hochschild, (iv) KDM, and (v) a variant of the KDM. |
200 |
30 to 70 years |
0% |
11: neurological sensitivity, lung capacity, neuromuscular capacity, neuropsychological tests. |
Compare biological age methods. |
|
22 |
Bai, X. |
(32) |
2011 |
China |
C |
Linear regression: The biological age score was taken as the dependent variable and the chronological age as the independent variable. |
2876 |
30 to 98 years |
53.0% |
7: cardiovascular characteristics, blood labs. |
Relationship between biological age and differences in some biomarkers of aging. |
|
23 |
Jee. H. |
(51) |
2012 |
South Korea |
RC |
PCA, MLRA, adjustment methods. |
4345 |
Men: 53.3 ± 8.5 years
Women: 52.4 ± 8.8 years |
28.0% |
8 according to sex: neuromuscular capacity, lung capacity, neuromuscular capacity, musculoskeletal characteristics, lung capacity, anthropometric measures, vital signs. |
Biological age and difference with chronological age, with clinical risk factors. |
|
24 |
Bashkirev, A.S. |
(96) |
2013 |
Russia |
C |
L.M. Belozerova formula |
300 |
Study group: 43.3 ± 0.9 years. Control group: 42.8 ± 0.9 years |
0% |
5: neuromuscular capacity, vital signs. |
Relationship between biological age and risk groups with signs of premature and/or accelerated aging. |
|
25 |
Zhang, W.G. |
(35) |
2013 |
China |
C |
PCA |
505 |
35 to 91 years |
Not specified |
8: neuropsychological tests, cardiovascular characteristics, lung capacity, blood labs. |
Biological age measurement. |
|
26 |
Fadeeva, N.I. |
(90) |
2014 |
Russia |
C |
Determination of biological age according to V.P. Voitenko and L..M. Belozerova. |
Not specified |
44.5 ± 0.17 years |
52.0% |
Belozerova: 5: anthropometric measures, lung capacity, neuromuscular capacity. Voitenko: 8: vital signs, lung capacity, neuromuscular capacity, neuropsychological tests, self-reports. |
Correlation with metabolic disorders with the enzymatic provision of metabolic processes and other parameters in relation to biological age determination methods. |
|
Author |
Ref. |
Year |
Nationality |
Type of study |
Biological age estimation method |
Number of subjects |
Age |
Women |
Biomarkers |
Outcomes |
|
|
27 |
Negasheva, M. |
(98) |
2014 |
Russia |
C |
BioAge Software, National Gerontological Center, Moscow, Russia, http://www.ngcrussia.org/ |
119 |
Women from 60 to 74 years. Women from 90 to 104 years |
100% |
At least 8: vital signs, lung capacity, neurological sensitivity, musculoskeletal characteristics, self-reports, neuropsychological tests. |
Somatic features, components of body mass and functional characteristics. |
|
28 |
Zhang, W.G. |
(33) |
2014 |
China |
C |
Own method by factor analysis |
139 |
60.3 ± 14.3 years |
51.0% |
7: molecular labs, cardiovascular characteristics, neuropsychological tests, blood labs. |
Biological age measurement. |
|
29 |
Belsky, D.W. |
(61) |
2015 |
United States |
RC |
KDM |
954 |
38 years |
48.0% |
10: blood labs, lung capacity, vital signs. |
Relations between the rate of aging, physical and cognitive capacity, and self- perception. |
|
30 |
Gołąb, S. |
(87) |
2015 |
Poland |
C |
Regression equations for somatic variables and age, and for total body water and age. |
1400 |
Men: 20 to 70 years |
0% |
5: anthropometric measures, musculoskeletal characteristics. |
Relation with physical activity and capacity. |
|
31 |
Schaefer, J.D. |
(62) |
2016 |
United States |
RC |
KDM |
1037 |
38.0 ± 3.0 years |
48.0% |
10: blood labs, lung capacity, vital signs. |
Relation of biological age and intelligence. |
|
32 |
Mikhaylova, N.A. |
(91) |
2016 |
Russia |
C |
Method of the Institute of Gerontology of the Academy of Medical Sciences of the USSR (Kiev, 1984). |
85 |
42.7 ± 1.2 years |
0% |
4: vital signs, neuromuscular capacity, lung capacity, self- reports. |
Difference between chronological and Biological Aging. |
|
33 |
Belsky, D.W. |
(64) |
2017 |
United States |
RC |
KDM |
220 |
38.0 ± 7.0 years |
70.0% |
10: blood labs, vital signs. |
Aging-related changes in organ system function. |
|
34 |
Yoo, j. |
(45) |
2017 |
South Korea |
RC |
PCA |
469754 |
43.5 years |
43.0% |
15: anthropometric measures, vital signs, lung capacity, blood labs, musculoskeletal characteristics. |
Mortality. |
|
35 |
Finkel, D. |
(63) |
2017 |
United States |
RC |
Functional biological age (fBioAge) |
740 |
Not specified |
59.0% |
5: neuromuscular capacity, neuromuscular capacity, lung capacity, self-reports. |
Possible gender differences and genetic and environmental influences on change with age. |
|
36 |
Jee, H. |
(46) |
2017 |
South Korea |
C |
MLRA, PCA and KDM statistical methods were applied to obtain three different sets of biological age prediction models. |
3642 |
30 to 80 years |
100% |
8: vital signs, anthropometric measures, lung capacity, blood labs. |
Biological age as a function of chronological age. |
|
37 |
Negasheva, M. |
(113) |
2017 |
Russia |
C |
PCA |
481 |
Moscow: 72.8 ± 1,97 years; Tiraspol: 75.2 ± 1.0 years; Barnaul: 75.4 ± 0.7 years |
47.0% |
7: anthropometric measures, musculoskeletal characteristics. |
Correlation with chronological age. |
|
38 |
Zhang, W.G. |
(34) |
2017 |
China |
C |
PCA |
1373 |
Men: 57.1 years.
Women: 55.1 years |
58.0% |
5: cardiovascular characteristics, neuropsychological tests, blood labs. |
Difference between biological and chronological age. |
|
39 |
Li, X. |
(102) |
2018 |
China |
CCT |
Own regression equations derived from MLRA |
915 |
Men: 50.9 ± 10.6 years Women: 51.2 ± 11.8 years |
36.0% |
7: blood labs |
Change of biomarkers in aging. |
|
40 |
Belsky, D.W. |
(65) |
2018 |
United States |
RC |
KDM |
964 |
38 .0 ± 3.0 years |
48.0% |
10: blood labs, lung capacity, vital signs. |
Worsening of physical functioning, impairment, cognitive impairment, and subjective perceptions of impaired health. |
|
41 |
Lin, H. |
(59) |
2018 |
United States |
RC |
KDM |
2163 |
67.0 ± 9.0 years |
55.0% |
6: vital signs, lung capacity, blood labs. |
Relation between chronological age and gene expression in whole blood measured using the Affymetrix Human Exon 1.0st Array. |
|
42 |
Kang, Y.G. |
(44) |
2018 |
South Korea |
RC |
PCA |
484724 |
50.7 ± 14.1 years |
46.0% |
Men 7 biomarkers: anthropometric measures, vital signs, blood labs. Women 10 biomarkers: anthropometric measures, vital signs, blood labs. |
Mortality and morbidity. |
|
Author |
Ref. |
Year |
Nationality |
Type of study |
Biological age estimation method |
Number of subjects |
Age |
Women |
Biomarkers |
Outcomes |
|
|
43 |
Pyrkov, T.V. |
(94) |
2018 |
Russia |
RC |
PCA, a multivariate linear regression and a state-of-the-art deep convolutional neural network. |
7454 |
35.0 ± 23.0 years |
51.0% |
7: individual characteristics, personal history, neuromuscular capacity. |
Mortality. |
|
44 |
Pyrkov, T.V. |
(93) |
2018 |
Russia |
RC |
PCA |
11839 |
35.0 ± 23.0 years |
51.0% |
Not specified |
Mortality and chronic diseases. |
|
45 |
Mikhaylova, S.V. |
(92) |
2018 |
Russia |
C |
Voitenko method and Bio-Age scale |
602 |
20 .0 ± 2.0 years |
58.0% |
9: blood labs, vital signs, musculoskeletal characteristics, cardiovascular characteristics. |
Difference between biological and chronological age. |
|
46 |
Liu, Z. |
(70) |
2018 |
United States |
PC |
Phenotypic Age |
11432 |
45.5 years |
50.8% |
9: Blood labs |
All-cause mortality and cause-specific mortality |
|
47 |
Levine, M.E. |
(71) |
2018 |
United States |
RC |
DNAm PhenoAge |
456 |
21-100 years |
51.0% |
513: blood labs, epigenetic information, DNA methylation levels |
All-cause mortality, cancers, healthspan, physical functioning, and Alzheimer’s disease |
|
48 |
Johnson, L.C. |
(55) |
2019 |
United States |
PC |
KDM |
604 |
59.0 ± 1.0 years |
42.0% |
13: anthropometric measures, musculoskeletal characteristics, vital signs, blood labs, cardiovascular characteristics, lung capacity. |
Plasma metabolomic signatures associated with biological age, including some that could predict whether individuals would age at a faster or slower rate. |
|
49 |
Earls, J.C. |
(56) |
2019 |
United States |
RC |
KDM with transformation of PCA |
3558 |
47.6 ± 12.2 years |
58.0% |
900: Genomic, proteomic and metabolomic. |
Rate of aging, inflammation, bioaccumulation of toxins, chronic diseases. |
|
50 |
Hastings, W.J. |
(69) |
2019 |
United States |
RC |
KDM, LM |
6731 |
49.6 ± 17.7 years |
48.0% |
KDM: 12: blood labs, vital signs. LM: 9: blood labs. |
Relation with functional capacities, healthy life, low educational level, deficit of material and social resources and mental health problems. |
|
51 |
Jee, H. |
(49) |
2019 |
South Korea |
RC |
MLRA, PCA, KDM |
940 |
49.9 ± 10.8 years |
0% |
6: lung capacity, vital signs, blood labs, anthropometric measures. |
Compare the mobility dimension of the Euro Quality of Life-5 for the viability test of each biological age model. |
|
52 |
Elliott, M.L. |
(58) |
2019 |
United States |
RC |
Own: Aging rate: The change over time in each biomarker was modeled with mixed-effects growth models, and these rates of change were combined into a single years-scaled index of physiological change occurring per chronological year. |
869 |
45.1 ± 0.7 years |
48.0% |
19: anthropometric measures, vital signs, blood labs, lung capacity, individual characteristics. |
Relationship between biological aging and cognitive decline. |
|
53 |
Meisel, P. |
(111) |
2019 |
Germany |
RC |
MLRA to construct biological age, separated for both sexes. |
2049 |
Men: 46.2 ± 13.4 years Women: 44.7 ± 13.2 years |
52.0% |
Not specified |
Predict tooth loss in the follow-up cohort compared to the chronological age of each participant. |
|
54 |
Sternäng, O. |
(112) |
2019 |
Switzerland |
RC |
Own: Variables were transformed into z-scores |
400 |
68.6 ± 5.4 years |
52.0% |
4: neuromuscular capacity, lung capacity, neurological sensitivity. |
Relations with cognitive skills (episodic recall and recognition, verbal fluency, semantic knowledge, and processing speed). |
|
55 |
Waziry, R. |
(57) |
2019 |
United States |
RC |
KDM |
1699 |
70.0 (65.0–76.0) years |
57.0% |
9: blood labs, vital signs, lung capacity. |
Association with death and the appearance of age- related diseases. |
|
56 |
Bush, M.P. |
(95) |
2019 |
Russia |
C |
A.A. Podkolzin method |
110 |
30.2 (29.7–30.7) years |
0% |
Not specified |
State of the cardiovascular and respiratory systems and static balance. |
|
57 |
Pierleoni, P. |
(104) |
2019 |
Italy |
C |
MLRA |
15 |
61 to 81 years |
46.0% |
5: anthropometric measures, neuromuscular capacity |
Determine biological age |
|
Author |
Ref. |
Year |
Nationality |
Type of study |
Biological age estimation method |
Number of subjects |
Age |
Women |
Biomarkers |
Outcomes |
|
|
58 |
Beam, C.R. |
(66) |
2020 |
United States |
RC |
Own with LM recommendations |
40 |
51.1 ± 5.6 years |
62.0% |
7: blood labs, vital signs. |
Association between cognitive functioning and biological age. |
|
59 |
Belsky, D.W. |
(77) |
2020 |
England |
RC |
KDM, LM |
954 |
45.0 years |
48.0% |
8: blood labs, vital signs. |
Association between the rate of aging and a predictor of DNA methylation. |
|
60 |
Crimmins, E.M. |
(53) |
2020 |
United States |
RC |
LM |
4287 |
68.0 ± 8.3 years |
55.0% |
Biological age (extended) 10 biomarkers: blood labs, vital signs, lung capacity. |
Multimorbidity, loss of physical functioning, cognitive dysfunction, and mortality. |
|
61 |
Gaydosh, L. |
(54) |
2020 |
United States |
RC |
KDM |
951 |
67.4 ± 8.9 years |
Not specified |
11: blood labs, vital signs. |
Analysis of physical and cognitive function and mortality, comparing measures of biological aging with a norm-based biomarker index within our analysis sample and with participants’ ratings of their own health. |
|
62 |
Tze Pin, N.G. |
(100) |
2020 |
Singapore |
RC |
KDM |
2844 |
55 to 94; 67.0 ± 7.9 years |
62.0% |
Men, 8 biomarkers: blood labs, vital signs, lung capacity, neuromuscular capacity, neuropsychological tests. Women: 10 biomarkers: musculoskeletal characteristics, blood labs, vital signs, lung capacity, neuromuscular capacity, neuropsychological tests. |
Relation with education, housing status, loss of a spouse, living alone, lifestyle and health activity, smoking, alcohol consumption, nutritional risks, consumption of milk, soy, fruits, vegetables, coffee and tea, sleep parameters and satisfaction with life. |
|
63 |
Parker, D.C. |
(67) |
2020 |
United States |
RC |
KDM, LM |
1374 |
78.0 ± 5.4 years |
65.0% |
12: blood labs, vital signs. |
Associations of biological aging measures with participant-reported activities of daily living, instrumental activities of daily living dependencies, and mortality. |
|
64 |
Shirazi, T.N. |
(68) |
2020 |
United States |
RC |
KDM, LM |
4418 |
Premenopausal: 20 to 61; 34.9 years Postmenopausal: 41 to 84; 63.5 years |
100% |
9: blood labs. |
Biological age associated with parity. |
|
65 |
Zhong, X. |
(101) |
2020 |
Singapore |
RC |
PCA, MLRA and the KDM, and explored the use of machine learning methods for the prediction of mortality and frailty. |
2844 |
Men from 55 to 94 years, 67.9 years. Women from 55 to 93 years, 66.8 years. |
62.0% |
17: blood labs, vital signs, anthropometric measures, lung capacity, musculoskeletal characteristics, neuropsychological tests. |
Associations with risk factors and health outcomes. |
|
66 |
Bae, C-Y. |
(43) |
2021 |
South Korea |
RC |
Self-described and biological age of metabolic syndrome. |
6518532 |
Men: 48.8 ± 14.12 years Women: 52.0 ± 14.3 years |
52.0% |
5: anthropometric measures, cardiovascular characteristics, blood labs. |
Identify the relationship between age and lifestyle factors, such as smoking, drinking, and physical activity. |
|
67 |
Verschoo, C.P. |
(27) |
2021 |
Canada |
RC |
KDM in 6 different panels (panels: optimized, complete, blood, physical, performance and cognitive). |
30097 |
63.0 ± 10.3 years |
50.0% |
40: blood labs, vital signs, lung capacity, musculoskeletal characteristics, neuromuscular capacity, neuropsychological tests. |
Frailty, multimorbidity, chronic disease domains, disability, emergency room visits, and hospitalization. |
|
68 |
Berezina, T.N. |
(97) |
2021 |
Russia |
C |
V.P. Voitenko method |
987 |
35 to 70 years |
58.0% |
Not specified: lung capacity, cardiovascular characteristics, musculoskeletal characteristics, self-reports. |
Relation between personality traits and biological age. |
|
69 |
Cao, X. |
(36) |
2021 |
China |
RC |
Machine learning (Gradient Boosting Regressor, Random Forest, CatBoost Regressor, and Support Vector Machine), KDM. |
9771 |
59.1 ± 9.2 years |
53.5% |
16: blood labs, cardiovascular characteristics. |
Association with disability in basic activities and instrumental activities of daily living, morbidity, and mortality. |
|
70 |
Graf, G.H. |
(72) |
2021 |
United States |
RC |
KDM, PhenoAge, and homeostatic dysregulation |
9005 |
69 ± 9 years |
49.0% |
8: blood labs. |
Functional impairment, activities of daily living, chronic conditions, self- rated health, and mortality. |
|
Author |
Ref. |
Year |
Nationality |
Type of study |
Biological age estimation method |
Number of subjects |
Age |
Women |
Biomarkers |
Outcomes |
|
|
71 |
Lin, W.Y. |
(107) |
2021 |
Taiwan |
PC |
BioAge |
94443 |
Men: 48.9 ± 11.1 years
Women: 50.5 ± 11.2 years |
62.0% |
6: blood labs. |
Body mass index, smoking status, alcohol status, and single nucleotide polymorphisms. |
|
72 |
Chan, M.S. |
(78) |
2021 |
England |
PC |
KDM |
141254 |
56.0 years |
53.0% |
72: blood labs, vital signs, lung capacity, cardiovascular characteristics, musculoskeletal characteristics. |
Overall biomarker, mortality, and age-related hospital admissions. |
|
73 |
Liu, Z. |
(37) |
2020 |
China |
PC |
KDM, physiological dysregulation |
17423 |
1: 49.9 ± 14.1 years
and 2: 59.3 ± 9.4 years |
53.4% |
12: blood labs, vital signs, musculoskeletal characteristics. |
Morbidity, mortality, and health behaviors. |
|
74 |
Zinatullina, A.M. |
(99) |
2021 |
Russia |
C |
V.P. Voitenko |
347 |
56-69 years |
61.0% |
Not specified.. |
Difference between working and non-working people. |
|
75 |
Farina, M.P. |
(73) |
2022 |
United States |
PC |
KDM |
4134 |
68.1 ± 98.3 years |
55.3 % |
22: demographics, blood labs, vital signs, cardiovascular and lung capacity. |
Lifetime socioeconomic conditions contributed to racial/ethnic differences in biological aging. |
|
76 |
Wang, S. |
(38) |
2022 |
China |
PC |
Multidimensional aging measure (MDAge) - random forest algorithm. |
308951 |
41.9 ± 14.0 years |
52.8% |
14: anthropometric measures, blood labs, lung capacity. |
Morbidity and mortality. |
|
77 |
Husted, K.L.S. |
(108) |
2022 |
Denmark |
C |
PCA |
31 |
18-54 years |
52.0% |
9: anthropometric measures, vital signs, blood labs, lung capacity. |
Calculate biological age. |
|
76 |
Jáni, M. |
(89) |
2022 |
Czech Republic |
PC |
KDM |
262 |
28–30 years |
48.0% |
9: vital signs, blood labs, lung capacity. |
Body mass index and body fat. |
|
77 |
Li, Z. |
(39) |
2023 |
China |
C |
KDM, MLRA, PCA |
1207 |
21-91 years |
51.0% |
9: blood labs, vital signs, cardiovascular and lung capacity. |
Compare biological ages. |
|
78 |
Shapiro, I. |
(109) |
2022 |
Israel |
RC |
KDM |
1473 |
32.0 ± 1.1 years |
50.3% |
13: anthropometric measures, blood labs, vital signs. |
Parental all-cause and cause-specific mortality. |
|
79 |
Dmitrieva, N.I. |
(74) |
2022 |
United States |
RC |
KDM |
15752 |
45-66 years |
53.0% |
15: vital signs, blood labs, lung capacity. |
Chronic diseases, and premature mortality. |
|
80 |
Fermín- Martínez, C.A. |
(110) |
2022 |
Mexico |
RC |
AnthropoAge |
6284 |
45.0 (31.0-64.0) years |
50.6% |
3-5: anthropometric measures. |
Cause-specific mortality and comorbidities. |
|
81 |
Yang, Q. |
(40) |
2022 |
China |
RC |
Machine learning |
77144 |
45–90 years |
Not specified |
17: anthropometric measures, vital signs, blood labs, anthropometric measures. |
Models, healthy risk indicators and disease. |
|
82 |
Drewelies, J. |
(25) |
2022 |
Germany |
RC |
KDM |
1517 |
68.66 ± 3.62 years |
51.0% |
12: blood labs. |
Morbidity and mortality. |
|
83 |
Verschoor, C.P. |
(29) |
2022 |
Canada |
PC |
BioAge |
292 |
76 .0 ± 7.11 years |
65.0% |
10: blood labs. |
Antibody responses. |
|
84 |
Wei, K. |
(41) |
2022 |
China |
RC |
KDM |
130918 |
20-80 years |
52.0% |
5: blood labs. |
All-cause mortality. |
|
85 |
Bae, C-Y. |
(52) |
2022 |
South Korea |
RC |
PCA |
6971810 |
47.0 ± 13.9 years |
49.0% |
17: anthropometric measures, vital signs, blood labs, anthropometric measures. |
Incidence of age-related diseases. |
|
86 |
Graf, G.H. |
(75) |
2022 |
United States |
PC |
KDM |
607 |
41 .0 ± 4.0 years |
55.0% |
9: blood labs. |
Differences of maltreatment effect. |
|
87 |
Esposito, S. |
(105) |
2022 |
Italy |
C |
Deep Neural Network |
4510 |
55.6 ± 11.6 years |
52.0% |
36: bood labs. |
Relationship of four a priori– defined dietary patterns. |
|
88 |
Beltrán- Sánchez, H. |
(130) |
2022 |
United States |
RC |
SEM (outcome-free and outcome- dependent), MLRA, PCA, KDM |
9197 |
49.7 ± 13.6 years |
50.5% |
9: vital signs, blood labs, lung capacity. |
Biological age measurement. |
|
89 |
Gialluisi, A. |
(106) |
2022 |
Italy |
RC |
Deep neural network |
23858 |
55.9 ± 11.9 years |
51.7% |
40: blood labs. |
Mortality and hospitalization risk for all and specific causes. |
|
90 |
Chen, L. |
(42) |
2023 |
China |
RC |
KDM |
12377 |
57.0 ± 10.5 years |
50.2% |
25: anthropometric measures, vital signs, blood labs, anthropometric measures, lung capacity. |
Long-term risk of all-cause mortality. |
Recently, Jazwinski and Kim, emphasized the need to incorporate additional elements to improve the interpretation of the model used (127). For instance, including functional measurements that reflect the physiological state at any age could help identify physiological alterations marking the transition from a healthy to a vulnerable condition (128). In longitudinal studies, tracking hematological, renal, inflammatory, metabolic, pulmonary, and cardiovascular biomarkers over time could be beneficial (77). However, reference values or thresholds to determine these transitions have not been proposed yet. The models used to estimate biological age, especially those recently adopted in the aging phenotype to measure the pace of aging, could be considered a good starting point (16). These models incorporate differentbiomarkerswithbiologicalplausibilityand evaluate the occurrence of adverse outcomes over time, which could help define health trajectories, the rate of functional decline, and the transition from a healthy to a vulnerable state.
Mathematical modeling for the estimation of biological age with biomarkers was proposed 50 years ago (21). According to our findings, the most frequently applied methods are PCA, KDM, and MLRA. It is important to highlight that the statistical method used can influence the validity and reproducibility of the estimation of biological age, as each method has its advantages and disadvantages (Table 2) (129). For example, while PCA and MLRA select biomarkers based on their relationship with chronological age, which may produce distortions in the case of extreme values, KDM includes chronological age as an independent variable, overcoming the limitations of the former (117). Nevertheless, in all those methods biological age is modeled as a linear function of chronological age and multiple biomarkers which constrain the functional form of its relation. Structural equation model-based estimators recently proposed transcends the limitations of those methods and allow modeling the biological age as a latent variable expressed in multiple biomarkers and relax assumptions about functional relationship without restrictions on parameters (Table 2) (130). New prospective longitudinal studies are needed to compare current methodologies and determine which produces a satisfactory estimate with potential clinical utility.
This review was not previously registered. However, we rigorously followed the methodological design proposed a priori, in accordance with the PRISMA guidelines.
Our search was limited to five databases accessible to the authors. Nonetheless, by cross-referencing the cited literature, we evaluated most publications in the field, except for three inaccessible articles.
In scoping reviews, critical evaluation of research is not a generalized recommendation. However, conducting a critical evaluation could contribute to determining the methodological quality of ongoing research in the field.
Given the heterogeneity and variability of biological age determinants, relying on a single biomarker may not adequately account for its underlying complexity, as observed in our scoping review. Therefore, a panel of carefully selected biomarkers may accelerate progress towards a more reliable determination of biological age. There is a growing trend favoring a group of biomarkers that reflect different interconnected health processes or serve as biological indicators predicting functional capacity at a specific time point, surpassing the effec- tiveness of chronological age. We have identified that composite measures of biological age need to encompass different aspects of the aging process, ranging from developmental programs and DNA replication to tissue and organ function and whole- body physiological capacity. Therefore, as a by- product of the current scoping review and recent analysis of comparative measurement of biological age using various methods (131,132), we propose that future studies should analyze biological age as a composite phenotype (Table 3).
|
Method |
Concept |
Advantage |
Disadvantage |
|
Multiple linear regression analysis |
To predict biological age based on the linear coincidence of several biomarkers of aging associated with a given value of chronological age with a multiple linear regression. |
|
|
|
Principal component analysis |
It is a statistical method that is based on the observation of a series of biomarkers, generally correlated with each other, reducing them to a set of small factors called principal components, not correlated with each other. |
|
|
|
Klemera-Doubal method |
This is a computational analysis that tries to limit the distance between the values of the biological markers and the regression line determined by the regression functions in the space of all the biomarkers. |
|
|
|
Structural equation model |
Structural equation model- based estimators allow modeling the biological age as a latent variable expressed in multiple biomarkers. |
modeling of an outcome of physiological aging (morbidity and mortality). |
|
Table 2. Comparison of different methods to estimate biological age
To achieve this, quantitative measurement must encompass key elements, such as defining the composite measure and developing a statistical model that combines the selected biomarkers and physiological measures to estimate biological age. This model can be based on machine learning algorithms or other novel mathematical approaches, such as structural equation model-based estimators (130). These new methods, when applied to biological age estimation, improve empirical performance, and allow for multiple interpretations, serving as indicators of latent physiological deterioration. Additionally, the estimator of biological age should be anchored in the modeling of outcomes of physiological aging, such as morbidity and mortality (130).
Finally, the analysis should include exploring the associations between biological age and relevant outcomes, such as disease risk, mortality, and functional decline. With these provisions, the validity of composite biomarkers for determining biological age will enhance their utility as a clinical tool.
|
Component Description |
|
|
Phenotype definition |
Biological age is a measure of an individual’s physiological state relative to their chronological age. |
|
Composite measure |
A specified composite measure derived from multiple biomarkers and physiological indicators that capture various aspects of aging. |
|
Statistical model |
Techniques like machine learning and structural equation model employed to analyze and extract patterns from the data, enabling a more accurate estimation of biological age based on the combined information from various biomarkers, physiological measures, and outcomes. |
|
Associations and predictive power |
The associations between biological age and relevant outcomes, such as disease risk, mortality, and functional decline, can be examined by comparing them to other traditional risk factors. |
|
Interventions |
By examining how interventions affect biological age over time, researchers can gain a deeper understanding of the mechanisms underlying the aging process and identify effective strategies to promote healthy aging and potentially extend lifespan. |
|
Longitudinal studies (preferred) |
Longitudinal studies as an effective approach to track changes in biological age over extended periods, allowing researchers to observe how biological age evolves and understand the factors that influence age trajectories. |
Table 3. A proposed approach to studying biological age as a complex phenotype through six key components.
A combined measure involves taking into account various components that collectively contribute to the quantification of the biological aging process. By breaking it down into distinct components, researchers can focus on specific biomarkers, advanced statistical methods, and physiological systems that are more relevant to biological aging. This approach allows for a more precise and nuanced evaluation of an individual’s aging status, potentially leading to more accurate estimates of biological age and a better understanding of the underlying factors contributing to age-related biological decline.
Conclusion
In recent years, the study of biological age has been a highly active research area due to the increasing longevity of populations worldwide. However, there is significant variability in the number and types of biomarkers used, as well as the methods employed to estimate biological age. Currently, there is no universally accepted gold standard for assessing biological age. Additionally, there is a need for studies to evaluate the reproducibility and prognostic validity of current measurement approaches. Based on our scoping review, we have identified key aspects that should be considered when proposing new research related to the study of biological age as a useful indicator of healthy longevity.
Conflicts of interest
The authors declare no conflicts of interest with the work.
Funding
This research was funded by the Ministry of Science, Technology and Innovation (Minciencias), Colombia. Project 221377758352, contract 763 of 2018.
Acknowledgments
Authors thank the Ministry of Science, Technology, and Innovation from Colombia (Minciencias) and Clinical and Research Center SICOR in Medellin, Colombia.
References
Scherbov S, Sanderson WC. New Approaches to the Conceptualization and Measurement of Age and Ageing. Springer Series on Demographic Methods and Population Analysis [Internet]. 2020 [cited 2023 Jul 31];49:243–58. Available from: https://link.springer.com/chapter/10.1007/978-3-030-42472-5_12
Ferrucci L, Levine ME, Kuo PL, Simonsick EM. Time and the Metrics of Aging. Circ Res [Internet]. 2018 Sep 14 [cited 2023 Jul 31];123(7):740–4. Available from: https://www.ahajournals.org/doi/abs/10.1161/ CIRCRESAHA.118.312816
Dey AB. World report on ageing and health. Indian J Med Res [Internet]. 2017 [cited 2021 Dec 7];145(1):150. Available from: /pmc/articles/ PMC5460566/
Beard JR, Officer AM, Cassels AK. The World Report on Ageing and Health. Gerontologist [Internet]. 2016 Apr 1 [cited 2021 Dec 7];56 Suppl 2:S163–6. Available from: https://pubmed.ncbi.nlm.nih. gov/26994257/
Michel JP, Graf C, Ecarnot F. Individual healthy aging indices, measurements and scores. Aging Clin Exp Res [Internet]. 2019 Dec 1 [cited 2021 Dec 7];31(12):1719–25. Available from: https://pubmed.ncbi.nlm.nih.gov/31463926/
Dodig S, Čepelak I, Pavić I. Hallmarks of senescence and aging. Biochem Med (Zagreb) [Internet]. 2019 Oct 1 [cited 2021 Dec 7];29(3). Available from: https://pubmed.ncbi.nlm.nih.gov/31379458/
Han JDJ, Xia X, Chen W, McDermott J. Molecular and phenotypic biomarkers of aging. F1000Res [Internet]. 2017 [cited 2021 Dec 7];6. Available from: /pmc/articles/PMC5473407/
Crimmins E, Vasunilashorn S, Kim JK, Alley D. Biomarkers related to aging in human populations. Adv Clin Chem [Internet]. 2008 [cited 2021 Dec 7];46:161. Available from: /pmc/articles/PMC5938178/
Caselli RJ, Locke DEC, Dueck AC, Knopman DS, Woodruff BK, Hoffman-Snyder C, et al. The neuropsychology of normal aging and preclinical Alzheimer’s disease. Alzheimers Dement [Internet]. 2014 Jan [cited 2021 Dec 7];10(1):84–92. Available from: /pmc/ articles/PMC3700591/
Palacios G, Pedrero-Chamizo R, Palacios N, Maroto-Sánchez B, Aznar S, González-Gross M. Biomarkers of physical activity and exercise. Nutr Hosp. 2015 Feb 26;31:237–44.
Wagner KH, Cameron-Smith D, Wessner B, Franzke B. Biomarkers of Aging: From Function to Molecular Biology. Nutrients [Internet]. 2016 Jun 1 [cited 2021 Dec 7];8(6). Available from: https://pubmed.ncbi.nlm.nih.gov/27271660/
Khan SS, Singer BD, Vaughan DE. Molecular and physiological manifestations and measurement of aging in humans. Aging Cell [Internet]. 2017 Aug 1 [cited 2021 Dec 7];16(4):624–33. Available from: https://pubmed.ncbi.nlm.nih.gov/28544158/
Skirbekk VF, Staudinger UM, Cohen JE. How to Measure Population Aging? The Answer Is Less than Obvious: A Review. Gerontology [Internet]. 2019 Mar 1 [cited 2021 Dec 7];65(2):136–44. Available from: https://pubmed.ncbi.nlm.nih.gov/30544101/
Jylhävä J, Pedersen NL, Hägg S. Biological Age Predictors. EBioMedicine [Internet]. 2017 Jul 1 [cited 2021 Dec 7];21:29–36. Available from: https://pubmed.ncbi.nlm.nih.gov/28396265/
Sebastiani P, Thyagarajan B, Sun F, Schupf N, Newman AB, Montano M, et al. Biomarker signatures of aging. Aging Cell [Internet]. 2017 Apr 1 [cited 2021 Dec 7];16(2):329–38. Available from: https://pubmed.ncbi.nlm.nih.gov/28058805/
Ferrucci L, Gonzalez-Freire M, Fabbri E, Simonsick E, Tanaka T, Moore Z, et al. Measuring biological aging in humans: A quest. Aging Cell [Internet]. 2020 Feb 1 [cited 2021 Dec 7];19(2). Available from: /pmc/ articles/PMC6996955/
Martin-Ruiz C, Von Zglinicki T. Biomarkers of healthy ageing: expectations and validation. Proc Nutr Soc [Internet]. 2014 [cited 2021 Dec 7];73(3):422–9. Available from: https://pubmed.ncbi.nlm.nih.gov/24810550/
Arksey H, O’Malley L. Scoping studies: towards a methodological framework. https://doi. org/101080/1364557032000119616 [Internet]. 2007 Feb [cited 2021 Dec 7];8(1):19–32. Available from: https://www.tandfonline.com/doi/abs/10.1080/1364557032000119616
Munn Z, Peters MDJ, Stern C, Tufanaru C, McArthur A, Aromataris E. Systematic review or scoping review? Guidance for authors when choosing between a systematic or scoping review approach. BMC Med Res Methodol [Internet]. 2018 Nov 19 [cited 2022 Jan 17];18(1):1–7. Available from: https://bmcmedresmethodol.biomedcentral.com/articles/10.1186/s12874-018-0611-x
Tricco AC, Lillie E, Zarin W, O’Brien KK, Colquhoun H, Levac D, et al. PRISMA extension for scoping reviews (PRISMA-ScR): Checklist and explanation. Ann Intern Med. 2018 Oct 2;169(7):467–73.
Heikkinen E, Kiiskinen A, Käyhty B, Rimpelä M, Vuori I. Assessment of Biological Age. Gerontology [Internet]. 1974 [cited 2022 Jan 12];20(1):33–43. Available from: https://www.karger.com/Article/Full-Text/211996
Meisel P, Pink C, Nauck M, Völzke H, Kocher T. Construction of a Biological Age Score to Predict Tooth Loss over 10 Years. J Dent Res [Internet]. 2019 Sep 1 [cited 2022 Jan 17];98(10):1096–102. Available from: https://pubmed.ncbi.nlm.nih.gov/31256728/
Freude G, Jakob O, Martus P, Rose U, Seibt R. Predictors of the discrepancy between calendar and biological age. Occup Med (Lond) [Internet]. 2010 Aug 10 [cited 2022 Jan 17];60(1):21–8. Available from: https://pubmed.ncbi.nlm.nih.gov/19666964/
Martin H, Huth M, Kratzsch J, Martin R, Reuter W, Richter V, et al. [Age dependence of laboratory parameters in a health study--attempt at calculating a laboratory index for assessing biological aging]. Z Gerontol Geriatr [Internet]. 2002 [cited 2022 Jan 17];35(1):2–12. Available from: https://pubmed.ncbi.nlm.nih.gov/11974512/
Drewelies J, Hueluer G, Duezel S, Vetter VM, Pawelec G, Steinhagen-Thiessen E, et al. Using blood test parameters to define biological age among older adults: association with morbidity and mortality independent of chronological age validated in two separate birth cohorts. Geroscience [Internet]. 2022 Dec 1 [cited 2023 Mar 25];44(6):2685–99. Available from: https://pubmed.ncbi.nlm.nih.gov/36151431/
Anstey KJ, Smith GA. Interrelationships among biological markers of aging, health, activity, acculturation, and cognitive performance in late adulthood. Psychol Aging [Internet]. 1999 [cited 2022 Jan 17];14(4):605–18. Available from: https://pubmed.ncbi.nlm.nih.gov/10632148/
Verschoor CP, Belsky DW, Ma J, Cohen AA, Griffith LE, Raina P. Comparing biological age estimates using domain-specific measures from the canadian longitudinal study on aging. Journals of Gerontology Series A Biological Sciences and Medical Sciences. 2021 Feb 1;76(2):187–94.
MacDonald SWS, Dixon RA, Cohen AL, Hazlitt JE. Biological age and 12-year cognitive change in older adults: findings from the Victoria Longitudinal Study. Gerontology [Internet]. 2004 [cited 2022 Jan 17];50(2):64–81. Available from: https://pubmed.ncbi.nlm.nih.gov/14963373/
Verschoor CP, Belsky DW, Andrew MK, Haynes L, Loeb M, Pawelec G, et al. Advanced biological age is associated with improved antibody responses in older high-dose influenza vaccine recipients over four consecutive seasons. Immun Ageing [Internet]. 2022 Dec 1 [cited 2023 Mar 25];19(1). Available from: https://pubmed.ncbi.nlm.nih.gov/35999604/
Li X, Zhang J, Sun C, Zhang Y, Cai R, Fu S, et al. Application of biological age assessment of Chinese population in potential anti-ageing technology. Immunity and Ageing [Internet]. 2018 Dec 18 [cited 2021 Dec 11];15(1):1–9. Available from: https://immunityageing.biomedcentral.com/articles/10.1186/ s12979-018-0140-9
Goggins WB, Woo J, Sham A, Ho SC. Frailty index as a measure of biological age in a Chinese population. J Gerontol A Biol Sci Med Sci [Internet]. 2005 [cited 2022 Jan 17];60(8):1046–51. Available from: https://pubmed.ncbi.nlm.nih.gov/16127111/
Bai X, Han L, Liu Q, Shan H, Lin H, Sun X, et al. Evaluation of Biological Aging Process – A Population-Based Study of Healthy People in China. Gerontology [Internet]. 2010 Mar [cited 2022 Jan 17];56(2):129–40. Available from: https://www.karger.com/Article/FullText/262449
Zhang WG, Zhu SY, Bai XJ, Zhao DL, Jiang SM, Li J, et al. Select aging biomarkers based on telomere length and chronological age to build a biological age equation. Age (Omaha) [Internet]. 2014 [cited 2022 Jan 17];36(3):1201–11. Available from: /pmc/ articles/PMC4082565/
Zhang W, Jia L, Cai G, Shao F, Lin H, Liu Z, et al. Model Construction for Biological Age Based on a Cross-Sectional Study of a Healthy Chinese Han population. J Nutr Health Aging [Internet]. 2017 Dec 1 [cited 2022 Jan 17];21(10):1233–9. Available from: https://pubmed.ncbi.nlm.nih.gov/29188884/
Zhang WG, Bai XJ, Sun XF, Cai GY, Bai XY, Zhu SY, et al. Construction of an integral formula of biological age for a healthy Chinese population using principle component analysis. J Nutr Health Aging [Internet]. 2014 [cited 2022 Jan 17];18(2):137–42. Available from: https://pubmed.ncbi.nlm.nih.gov/24522464/
Cao X, Yang G, Jin X, He L, Li X, Zheng Z, et al. A Machine Learning-Based Aging Measure Among Middle-Aged and Older Chinese Adults: The China Health and Retirement Longitudinal Study. Front Med (Lausanne) [Internet]. 2021 Dec 1 [cited 2023 Mar 25];8. Available from: https://pubmed.ncbi.nlm.nih.gov/34926482/
Liu Z. Development and Validation of 2 Composite Aging Measures Using Routine Clinical Biomarkers in the Chinese Population: Analyses From 2 Prospective Cohort Studies. J Gerontol A Biol Sci Med Sci [Internet]. 2021 Sep 1 [cited 2023 Mar 25];76(9):1627–32. Available from: https://pubmed.ncbi.nlm.nih.gov/32946548/
Wang S, Wen CP, Li W, Li S, Sun M, Xu A, et al. Development of a Novel Multi-dimensional Measure of Aging to Predict Mortality and Morbidity in the Prospective MJ Cohort. J Gerontol A Biol Sci Med Sci [Internet]. 2022 Aug 3 [cited 2023 Mar 25]; Available from: https://pubmed.ncbi.nlm.nih.gov/35921680/
Li Z, Zhang W, Duan Y, Niu Y, He Y, Chen Y, et al. Biological age models based on a healthy Han Chinese population. Arch Gerontol Geriatr [Internet]. 2023 Apr 1 [cited 2023 Mar 25];107. Available from: https://pubmed.ncbi.nlm.nih.gov/36542874/
Yang Q, Gao S, Lin J, Lyu K, Wu Z, Chen Y, et al. A machine learning-based data mining in medical examination data: a biological features-based biological age prediction model. BMC Bioinformatics [Internet]. 2022 Dec 1 [cited 2023 Mar 25];23(1). Available from: https://pubmed.ncbi.nlm.nih.gov/36192681/
Wei K, Peng S, Liu N, Li G, Wang J, Chen X, et al. All-Subset Analysis Improves the Predictive Accuracy of Biological Age for All-Cause Mortality in Chinese and U.S. Populations. The Journals of Gerontology: Series A [Internet]. 2022 Nov 21 [cited 2023 Mar 25];77(11):2288–97. Available from: https://academic.oup.com/biomedgerontology/article/77/11/2288/6568174
Chen L, Zhang Y, Yu C, Guo Y, Sun D, Pang Y, et al. Modeling biological age using blood biomarkers and physical measurements in Chinese adults. EBioMedicine [Internet]. 2023 Mar 1 [cited 2023 Mar 25];89. Available from: https://pubmed.ncbi.nlm.nih. gov/36758480/
Bae CY, Piao M, Kim M, Im Y, Kim S, Kim D, et al. Biological age and lifestyle in the diagnosis of metabolic syndrome: the NHIS health screening data, 2014–2015. Scientific Reports 2021 11:1 [Internet]. 2021 Jan 11 [cited 2021 Dec 11];11(1):1–11. Available from: https://www.nature.com/articles/s41598-020-79256-4
Kang YG, Suh E, Lee JW, Kim DW, Cho KH, Bae CY. Biological age as a health index for mortality and major age-related disease incidence in Koreans: National Health Insurance Service – Health screening 11-year follow-up study. Clin Interv Aging [Internet]. 2018 Mar 20 [cited 2021 Dec 11];13:429. Available from: /pmc/articles/PMC5865564/
Yoo J, Kim Y, Cho ER, Jee SH. Biological age as a useful index to predict seventeen-year survival and mortality in Koreans. BMC Geriatr [Internet]. 2017 Jan 5 [cited 2021 Dec 11];17(1). Available from: https://pubmed.ncbi.nlm.nih.gov/28056846/
Jee H, Park J. Selection of an optimal set of biomarkers and comparative analyses of biological age estimation models in Korean females. Arch Gerontol Geriatr [Internet]. 2017 May 1 [cited 2022 Jan 17];70:84–91. Available from: https://pubmed.ncbi.nlm.nih.gov/28110151/
Bae CY, Kang YG, Kim S, Cho C, Kang HC, Yu BY, et al. Development of models for predicting biological age (BA) with physical, biochemical, and hormonal parameters. Arch Gerontol Geriatr. 2008 Sep 1;47(2):253–65.
Cho IH, Park KS, Lim CJ. An empirical comparative study on biological age estimation algorithms with an application of Work Ability Index (WAI). Mech Ageing Dev [Internet]. 2010 Feb [cited 2022 Jan 17];131(2):69–78. Available from: https://pubmed.ncbi.nlm.nih.gov/20005245/
Jee H. Selection of a set of biomarkers and comparisons of biological age estimation models for Korean men. J Exerc Rehabil [Internet]. 2019 Feb 1 [cited 2022 Jan 17];15(1):31–6. Available from: https://pubmed.ncbi.nlm.nih.gov/30899733/
Park JH, Cho BL, Kwon HT, Lee CM. Developing a biological age assessment equation using principal component analysis and clinical biomarkers of aging in Korean men. Arch Gerontol Geriatr [Internet]. 2009 Jul [cited 2022 Jan 17];49(1):7–12. Available from: https://pubmed.ncbi.nlm.nih.gov/18597867/
Jee H, Jeon BH, Kim YH, Kim HK, Choe J, Park J, et al. Development and application of biological age prediction models with physical fitness and physiological components in Korean adults. Gerontology [Internet]. 2012 Jun [cited 2022 Jan 17];58(4):344–53. Available from: https://pubmed.ncbi.nlm.nih.gov/22433233/
Bae CY, Kim I hee, Kim B seon, Kim J hoon, Kim J hyun. Predicting the incidence of age-related diseases based on biological age: The 11-year national health examination data follow-up. Arch Gerontol Geriatr. 2022 Nov 1;103:104788.
Crimmins EM, Thyagarajan B, Kim JK, Weir D, Faul J. Quest for a summary measure of biological age: the health and retirement study. Geroscience [Internet]. 2021 Feb 1 [cited 2021 Dec 11];43(1):395–408. Available from: https://pubmed.ncbi.nlm.nih. gov/33544281/
Gaydosh L, Belsky DW, Glei DA, Goldman N, Le Couteur D. Testing Proposed Quantifications of Biological Aging in Taiwanese Older Adults. The Journals of Gerontology: Series A [Internet]. 2020 Sep 16 [cited 2021 Dec 11];75(9):1680–5. Available from: https://academic.oup.com/biomedgerontology/article/75/9/1680/5578440
Johnson LC, Parker K, Aguirre BF, Nemkov TG, D’Alessandro A, Johnson SA, et al. The plasma metabolome as a predictor of biological aging in humans. Geroscience. 2019 Dec 1;41(6):895–906.
Earls JC, Rappaport N, Heath L, Wilmanski T, Magis AT, Schork NJ, et al. Multi-Omic Biological Age Estimation and Its Correlation With Wellness and Disease Phenotypes: A Longitudinal Study of 3,558 Individuals. The Journals of Gerontology: Series A [Internet]. 2019 Nov 13 [cited 2021 Dec 11];74(Supplement_1):S52–60. Available from: https://academic.oup.com/biomedgerontology/article/74/Supplement_1/S52/5625183
Waziry R, Gras L, Sedaghat S, Tiemeier H, Weverling GJ, Ghanbari M, et al. Quantification of biological age as a determinant of age-related diseases in the Rotterdam Study: a structural equation modeling approach. Eur J Epidemiol [Internet]. 2019 Aug 15 [cited 2021 Dec 11];34(8):793–9. Available from: https://pubmed.ncbi.nlm.nih.gov/30993509/
Elliott ML, Belsky DW, Knodt AR, Ireland D, Melzer TR, Poulton R, et al. Brain-age in midlife is associated with accelerated biological aging and cognitive decline in a longitudinal birth cohort. Mol Psychiatry [Internet]. 2021 Aug 1 [cited 2021 Dec 11];26(8):3829–38. Available from: https://pubmed.ncbi.nlm.nih.gov/31822815/
Lin H, Lunetta KL, Zhao Q, Mandaviya PR, Rong J, Benjamin EJ, et al. Whole Blood Gene Expression Associated With Clinical Biological Age. The Journals of Gerontology: Series A [Internet]. 2019 Jan 1 [cited 2021 Dec 11];74(1):81–8. Available from: https://academic.oup.com/biomedgerontology/article/74/1/81/5053907
Hochschild R. Improving the precision of biological age determinations. Part 2: Automatic human tests, age norms and variability. Exp Gerontol [Internet]. 1989 [cited 2022 Jan 17];24(4):301–16. Available from: https://pubmed.ncbi.nlm.nih.gov/2583248/
Belsky DW, Caspi A, Houts R, Cohen HJ, Corcoran DL, Danese A, et al. Quantification of biological aging in young adults. Proc Natl Acad Sci U S A [Internet]. 2015 Jul 28 [cited 2022 Jan 17];112(30):E4104–Available from: https://pubmed.ncbi.nlm.nih. gov/26150497/
Schaefer JD, Caspi A, Belsky DW, Harrington H, Houts R, Israel S, et al. Early-Life Intelligence Predicts Midlife Biological Age. J Gerontol B Psychol Sci Soc Sci [Internet]. 2016 Nov 1 [cited 2022 Jan 17];71(6):968. Available from: /pmc/articles/ PMC5067943/
Finkel D, Sternäng O, Wahlin Å. Genetic and Environmental Influences on Longitudinal Trajectories of Functional Biological Age: Comparisons Across Gender. Behav Genet [Internet]. 2017 Jul 1 [cited 2022 Jan 17];47(4):375. Available from: /pmc/articles/PMC5486850/
Belsky DW, Huffman KM, Pieper CF, Shalev I, Kraus WE, Anderson R. Change in the Rate of Biological Aging in Response to Caloric Restriction: CALERIE Biobank Analysis. J Gerontol A Biol Sci Med Sci [Internet]. 2017 Jan 1 [cited 2022 Jan 17];73(1):4–10. Available 1. from: https://pubmed.ncbi.nlm.nih. gov/28531269/
Belsky DW, Moffitt TE, Cohen AA, Corcoran DL, Levine ME, Prinz JA, et al. Eleven Telomere, Epigenetic Clock, and Biomarker-Composite Quantifications of Biological Aging: Do They Measure the Same Thing? Am J Epidemiol [Internet]. 2018 Jun 1 [cited 2022 Jan 17];187(6):1220–30. Available from: https://pubmed.ncbi.nlm.nih.gov/29149257/
Beam CR, Turkheimer E, Finkel D, Levine ME, Zandi E, Guterbock TM, et al. Midlife Study of the Louisville Twins: Connecting Cognitive Development to Biological and Cognitive Aging. Behav Genet [Internet]. 2020 Mar 1 [cited 2022 Jan 17];50(2):73–83. Available from: https://pubmed.ncbi.nlm.nih. gov/31820295/
Parker DC, Bartlett BN, Cohen HJ, Fillenbaum G, Huebner JL, Kraus VB, et al. Association of Blood Chemistry Quantifications of Biological Aging With Disability and Mortality in Older Adults. J Gerontol A Biol Sci Med Sci [Internet]. 2020 Jun 5 [cited 2022 Jan 17];75(9):1671–9. Available from: https://pubmed.ncbi.nlm.nih.gov/31693736/
Shirazi TN, Hastings WJ, Rosinger AY, Ryan CP. Parity predicts biological age acceleration in post-menopausal, but not pre-menopausal, women. Scientific Reports 2020 10:1 [Internet]. 2020 Nov 25 [cited 2022 Jan 17];10(1):1–13. Available from: https:// www.nature.com/articles/s41598-020-77082-2
Hastings WJ, Shalev I, Belsky DW. Comparability of biological aging measures in the National Health and Nutrition Examination Study, 1999-2002. Psychoneuroendocrinology [Internet]. 2019 Aug 1 [cited 2022 Jan 17];106:171–8. Available from: https://pubmed. ncbi.nlm.nih.gov/30999227/
Liu Z, Kuo PL, Horvath S, Crimmins E, Ferrucci L, Levine M. A new aging measure captures morbidity and mortality risk across diverse subpopulations from NHANES IV: A cohort study. PLoS Med [Internet]. 2018 Dec 1 [cited 2023 Mar 25];15(12):e1002718. Available from: https://journals.plos.org/plosmedicine/article?id=10.1371/journal.pmed.1002718
Levine ME, Lu AT, Quach A, Chen BH, Assimes TL, Bandinelli S, et al. An epigenetic biomarker of aging for lifespan and healthspan. Aging (Albany NY) [Internet]. 2018 Apr 1 [cited 2023 Mar 25];10(4):573. Available from: /pmc/articles/PMC5940111/
Graf GH, Crowe CL, Kothari M, Kwon D, Manly JJ, Turney IC, et al. Testing Black-White Disparities in Biological Aging Among Older Adults in the United States: Analysis of DNA-Methylation and Blood-Chemistry Methods. Am J Epidemiol [Internet]. 2022 Mar 24 [cited 2023 Mar 25];191(4):613–25. Available from: https://academic.oup.com/aje/article/191/4/613/6446894
Farina MP, Kim JK, Crimmins EM. Racial/Ethnic Differences in Biological Aging and Their Life Course Socioeconomic Determinants: The 2016 Health and Retirement Study. https://doi. org/101177/08982643221120743 [Internet]. 2022 Aug 19 [cited 2023 Mar 25]; Available from: https://journals.sagepub.com/doi/abs/10.1177/08982643221120743
Dmitrieva NI, Gagarin A, Liu D, Wu CO, Boehm M. Middle-age high normal serum sodium as a risk factor for accelerated biological aging, chronic diseases, and premature mortality. EBioMedicine [Internet]. 2023 Jan 1 [cited 2023 Mar 25];87. Available from: https://pubmed.ncbi.nlm.nih.gov/36599719/
Graf GH, Li X, Kwon D, Belsky DW, Widom CS. Biological aging in maltreated children followed up into middle adulthood. Psychoneuroendocrinology. 2022 Sep 1;143:105848.
Bulpitt C, Antikainen R, Markowe H, Shipley M. Mortality according to a prior assessment of biological age. Curr Aging Sci [Internet]. 2009 Jan 9 [cited 2022 Jan 17];2(3):193–9. Available from: https://pubmed.ncbi.nlm.nih.gov/20021413/
Belsky DW, Caspi A, Arseneault L, Baccarelli A, Corcoran D, Gao X, et al. Quantification of the pace of biological aging in humans through a blood test, the DunedinPoAm DNA methylation algorithm. Elife [Internet]. 2020 May 1 [cited 2022 Jan 17];9:1–56. Available from: /pmc/articles/PMC7282814/
Chan MS, Arnold M, Offer A, Hammami I, Mafham M, Armitage J, et al. A Biomarker-based Biological Age in UK Biobank: Composition and Prediction of Mortality and Hospital Admissions. J Gerontol A Biol Sci Med Sci [Internet]. 2021 Jun 14 [cited 2023 Mar 25];76(7):1295–302. Available from: https://pubmed.ncbi.nlm.nih.gov/33693684/
Nakamura E, Moritani T, Kanetaka A. Biological age versus physical fitness age in women. Eur J Appl Physiol Occup Physiol [Internet]. 1990 Oct [cited 2021 Dec 11];61(3–4):202–8. Available from: https://pubmed.ncbi.nlm.nih.gov/2282902/
Nakamura E, Miyao K. Sex differences in human biological aging. J Gerontol A Biol Sci Med Sci [Internet]. 2008 [cited 2022 Jan 17];63(9):936–44. Available from: https://pubmed.ncbi.nlm.nih.gov/18840798/
Nakamura E, Miyao K. A method for identifying biomarkers of aging and constructing an index of biological age in humans. J Gerontol A Biol Sci Med Sci [Internet]. 2007 [cited 2022 Jan 17];62(10):1096–105. Available from: https://pubmed.ncbi.nlm.nih. gov/17921421/
Nakamura E, Miyao K. Further evaluation of the basic nature of the human biological aging process based on a factor analysis of age-related physiological variables. J Gerontol A Biol Sci Med Sci [Internet]. 2003 Mar 1 [cited 2022 Jan 17];58(3):196–204. Available from: https://pubmed.ncbi.nlm.nih.gov/12634284/
Takeda H, Inada H, Inoue M, Yoshikawa H, Abe H. Evaluation of biological age and physical age by multiple regression analysis. Med Inform (Lond) [Internet]. 1982 [cited 2022 Jan 17];7(3):221–7. Available from: https://pubmed.ncbi.nlm.nih.gov/7162237/
Nakamura E, Kimura M, Nagata H, Miyao K, Ozeki T. [Evaluation of the progress of aging based on specific biological age as estimated by various physiological functions (author’s transl)]. undefined. 1982;36(6):853–62.
Nakamura E, Miyao K, Ozeki T. Assessment of biological age by principal component analysis. Mech Ageing Dev [Internet]. 1988 [cited 2022 Jan 17];46(1–3):1–18. Available from: https://pubmed.ncbi.nlm.nih.gov/3226152/
Lee MS, Tanaka K, Nakagaichi M, Nakadomo F, Watanabe K, Takeshima N, et al. The relative utility of health-related fitness tests and skilled motor performance tests as measures of biological age in Japanese men. Appl Human Sci [Internet]. 1996 [cited 2022 Jan 17];15(3):97–104. Available from: https://pubmed.ncbi.nlm.nih.gov/8718821/
Gołąb S, Woronkowicz A, Kryst Ł. Biological aging and physical fitness in men aged 20-70 years from Kraków, Poland. Am J Hum Biol [Internet]. 2016 Jul 1 [cited 2022 Jan 17];28(4):503–9. Available from: https://pubmed.ncbi.nlm.nih.gov/27416874/
Mrázová R, Doubal S, Letters PKN, 2007 undefined. Comparison of potential markers of the biological age of healthy male adults and paraplegics. nel.altamira. sk [Internet]. 2007 [cited 2022 Jan 17];28(6):801–6. Available from: http://nel.altamira.sk/userfiles/articlesnew/NEL280607A18.pdf
Jáni M, Zacková L, Piler P, Andrýsková L, Brázdil M, Marečková K. Birth outcomes, puberty onset, and obesity as long-term predictors of biological aging in young adulthood. Front Nutr [Internet]. 2023 Jan 10 [cited 2023 Mar 25];9. Available from: https://pubmed.ncbi.nlm.nih.gov/36704790/
Fadeeva N, Turova E, … TK… i lechebnoi fizicheskoi, 2014 U. Comparative analysis of the methods for the estimation of the biological age. europepmc.org [Internet]. 2014 [cited 2022 Jan 17]; Available from: https://europepmc.org/article/med/24864489
Mikhaylova NA, Novikova TA, Raykin SS. The evaluation of biological age and rate of aging of agricultural machine operators. Health Care of the Russian Federation. 2016;60(3):152–6.
Mikhaylova S V., Kuzmichev YuG, Krasnikova LI. Physiological and hygienic sbstantiation for rating scale of the biological age «Вio-age». Hygiene and Sanitation [Internet]. 2018 [cited 2022 Jan 17];97(7):642–7. Available from: https://www.rjhas. ru/jour/article/view/603
Pyrkov T V., Getmantsev E, Zhurov B, Avchaciov K, Pyatnitskiy M, Menshikov L, et al. Quantitative characterization of biological age and frailty based on locomotor activity records. Aging (Albany NY) [Internet]. 2018 Oct 1 [cited 2022 Jan 17];10(10):2973. Available from: /pmc/articles/PMC6224248/
Pyrkov T V., Slipensky K, Barg M, Kondrashin A, Zhurov B, Zenin A, et al. Extracting biological age from biomedical data via deep learning: too much of a good thing? Scientific Reports 2018 8:1 [Internet]. 2018 Mar 26 [cited 2022 Jan 17];8(1):1–11. Available from: https://www.nature.com/articles/s41598-018-23534-9
Bush MP, Diakovich MP. Characteristics of the level of somatic health and biological age of persons with neuro-stressful professional activity. Russian Journal of Occupational Health and Industrial Ecology [Internet]. 2019 May 31 [cited 2022 Jan 17];0(5):297–302. Available from: https://www.journal-irioh.ru/ jour/article/view/1362
Bashkireva AS. Evaluation of accelerated aging of commercial drivers on model of biological age based on parameters of physical work ability. Advances in Gerontology. 2013 Jul;3(3):236–42.
T.N. B, S.A. R. The influence of quarantine on the indicators of biopsychological age in Russia (longitudinal study). Journal of Modern Foreign Psychology [Internet]. 2021 [cited 2022 Jan 17];10(1):57–69. Available from: https://psyjournals.ru/en/jmfp/2021/ n1/Berezina_Rybtsov.shtml
Negasheva M, Lapshina N, Okushko R, Godina E. Biological age and tempos of aging in women over 60 in connection with their morphofunctional characteristics. J Physiol Anthropol [Internet]. 2014 [cited 2022 Jan 17];33(1). Available from: https://pubmed.ncbi. nlm.nih.gov/24887211/
Zinatullina AM, Melnik VP, Zimina AA. Personal factors of biological aging in working and non-working respondents in late maturity period. Int J Health Sci (Qassim) [Internet]. 2021 Dec 26 [cited 2023 Mar 25];5(3):639–48. Available from: https://sciencescholar.us/journal/index.php/ijhs/article/view/2790
Ng TP, Zhong X, Gao Q, Gwee X, Chua DQL, Larbi A. Socio-Environmental, Lifestyle, Behavioural, and Psychological Determinants of Biological Ageing: The Singapore Longitudinal Ageing Study. Gerontology [Internet]. 2020 Dec 1 [cited 2021 Dec 11];66(6):603–13. Available from: https://pubmed. ncbi.nlm.nih.gov/33197920/
Zhong X, Lu Y, Gao Q, Nyunt MSZ, Fulop T, Monterola CP, et al. Estimating Biological Age in the Singapore Longitudinal Aging Study. The Journals of Gerontology: Series A [Internet]. 2020 Sep 25 [cited 2021 Dec 11];75(10):1913–20. Available from: https://academic.oup.com/biomedgerontology/article/75/10/1913/5513185
Li X, Zhang J, Sun C, Zhang Y, Cai R, Fu S, et al. Application of biological age assessment of Chinese population in potential anti-ageing technology. Immunity and Ageing [Internet]. 2018 Dec 18 [cited 2022 Jan 17];15(1):1–9. Available from: https://immunityageing.biomedcentral.com/articles/10.1186/ s12979-018-0140-9
Dubina TL, Mints AY, Zhuk E V. Biological age and its estimation. III. Introduction of a correction to the multiple regression model of biological age in cross-sectional and longitudinal studies. Exp Gerontol [Internet]. 1984 [cited 2022 Jan 17];19(2):133– 43. Available from: https://pubmed.ncbi.nlm.nih. gov/6610563/
Pierleoni P, Belli A, Concetti R, Palma L, Pinti F, Raggiunto S, et al. Biological age estimation using an eHealth system based on wearable sensors. J Ambient Intell Humaniz Comput [Internet]. 2021 Apr 1 [cited 2023 Mar 25];12(4):4449–60. Available from: https://link.springer.com/article/10.1007/ s12652-019-01593-8
Esposito S, Gialluisi A, Costanzo S, Di Castelnuovo A, Ruggiero E, De Curtis A, et al. Mediterranean diet and other dietary patterns in association with biological aging in the Moli-sani Study cohort. Clinical Nutrition. 2022 May 1;41(5):1025–33.
Gialluisi A, Di Castelnuovo A, Costanzo S, Bonaccio M, Persichillo M, Magnacca S, et al. Exploring domains, clinical implications and environmental associations of a deep learning marker of biological ageing. Eur J Epidemiol [Internet]. 2022 Jan 1 [cited 2023 Mar 25];37(1):35–48. Available from: https://link. springer.com/article/10.1007/s10654-021-00797-7
Lin WY. Lifestyle Factors and Genetic Variants on 2 Biological Age Measures: Evidence From 94 443 Taiwan Biobank Participants. J Gerontol A Biol Sci Med Sci [Internet]. 2022 Jun 1 [cited 2023 Mar 25];77(6):1189–98. Available from: https://pubmed. ncbi.nlm.nih.gov/34427645/
Husted KLS, Brink-Kjær A, Fogelstrøm M, Hulst P, Bleibach A, Henneberg KÅ, et al. A Model for Estimating Biological Age From Physiological Biomarkers of Healthy Aging: Cross-sectional Study. JMIR Aging [Internet]. 2022 Apr 1 [cited 2023 Mar 25];5(2). Available from: https://pubmed.ncbi.nlm. nih.gov/35536617/
Shapiro I, Belsky DW, Israel S, Youssim I, Friedlander Y, Hochner H. Familial aggregation of the aging process: biological age measured in young adult offspring as a predictor of parental mortality. Geroscience [Internet]. 2023 Apr 1 [cited 2023 Mar 25];45(2). Available from: https://pubmed.ncbi.nlm. nih.gov/36401109/
Fermín-Martínez CA, Márquez-Salinas A, Guerra EC, Zavala-Romero L, Antonio-Villa NE, Fernández-Chirino L, et al. AnthropoAge, a novel approach to integrate body composition into the estimation of biological age. Aging Cell [Internet]. 2023 Jan 1 [cited 2023 Mar 25];22(1). Available from: https:// pubmed.ncbi.nlm.nih.gov/36547004/
Meisel P, Pink C, Nauck M, Völzke H, Kocher T. Construction of a Biological Age Score to Predict Tooth Loss over 10 Years. J Dent Res [Internet]. 2019 Sep 1 [cited 2021 Dec 11];98(10):1096–102. Available from: https://journals.sagepub.com/doi/abs/10.1177/0022034519861037
Sternäng O, Palmer K, Kabir ZN, Hasan MI, Wahlin Å. Associations Between Functional Biological Age and Cognition Among Older Adults in Rural Bangladesh: Comparisons With Chronological Age. J Aging Health [Internet]. 2019 Jun 1 [cited 2022 Jan 17];31(5):814–36. Available from: https://pubmed.ncbi.nlm.nih.gov/29441812/
Negasheva MA, Zimina SN, Lapshina NE, Sineva IM. Express Estimation of the Biological Age by the Parameters of Body Composition in Men and Women over 50 Years. Bull Exp Biol Med [Internet]. 2017 Jul 1 [cited 2022 Jan 17];163(3):405–8. Available from: https://pubmed.ncbi.nlm.nih.gov/28744635/
Freude G, Jakob O, Martus P, Rose U, Seibt R. Predictors of the discrepancy between calendar and biological age. Occup Med (Lond) [Internet]. 2010 Aug 10 [cited 2022 Jan 12];60(1):21–8. Available from: https://pubmed.ncbi.nlm.nih.gov/19666964/
Hochschild R. Improving the precision of biological age determinations. Part 1: A new approach to calculating biological age. Exp Gerontol [Internet]. 1989 [cited 2021 Dec 7];24(4):289–300. Available from: https://pubmed.ncbi.nlm.nih.gov/2684676/
Martin H, Huth M, Kratzsch J, Martin R, Reuter W, Richter V, et al. [Age dependence of laboratory parameters in a health study--attempt at calculating a laboratory index for assessing biological aging]. Z Gerontol Geriatr [Internet]. 2002 [cited 2022 Jan 12];35(1):2–12. Available from: https://pubmed.ncbi.nlm.nih.gov/11974512/
Klemera P, Doubal S. A new approach to the concept and computation of biological age. Mech Ageing Dev [Internet]. 2006 Mar [cited 2021 Dec 7];127(3):240–8. Available from: https://pubmed.ncbi.nlm.nih.gov/16318865/
Verschoor CP, Belsky DW, Ma J, Cohen AA, Griffith LE, Raina P. Comparing biological age estimates using domain-specific measures from the canadian longitudinal study on aging. Journals of Gerontology - Series A Biological Sciences and Medical Sciences. 2021 Feb 1;76(2):187–94.
Levine ME. Modeling the Rate of Senescence: Can Estimated Biological Age Predict Mortality More Accurately Than Chronological Age? J Gerontol A Biol Sci Med Sci [Internet]. 2013 Jun [cited 2021 Dec 7];68(6):667. Available from: /pmc/articles/ PMC3660119/
Voitenko, V.P., Tokar’, A.V., and Polyukhov AM. Method for Determination of Biological Age of a Man, in Gerontologiya i geriatriya. Gerontology and Geriatrics, Biological Age, Inheritance and Senescence. 1984;(Annual Bu:131–137.
Krut’ko, V. N., M. B. Slavin and TMSmirnova. Mathematical Foundations of Gerontology. Moscow, URSS publ. 2002;Vol. 4(A series “The Problems of Gerontology”):384 p.
Belozerova LM. Ontogenetic approach to determination of human biological age. Uspekhi gerontologii (Advances in Gerontology). 1999;no. 3:108–112.
Anstey KJ, Lord SR, Smith GA. Measuring human functional age: a review of empirical findings. Exp Aging Res [Internet]. 1996 Jul 1 [cited 2021 Dec 7];22(3):245–66. Available from: https://pubmed.ncbi.nlm.nih.gov/8872080/
Krut’ko V.N., Doncov V.I., Mamikonova O.A. P, V.V. RSI. Aging diagnostics and biological age in antiaging medicine [Diagnostika starenija i biologicheskij vozrast v medicine antistarenija]. Medicinskie novosti. 2015;(2):25–31.
Kirkwood TBL. Understanding the odd science of aging. Cell [Internet]. 2005 Feb 25 [cited 2022 Jan 18];120(4):437–47. Available from: https://pubmed. ncbi.nlm.nih.gov/15734677/
Arbeev KG, Ukraintseva S V., Akushevich I, Kulminski AM, Arbeeva LS, Akushevich L, et al. Age trajectories of physiological indices in relation to healthy life course. Mech Ageing Dev [Internet]. 2011 Mar [cited 2022 Jan 19];132(3):93. Available from: /pmc/articles/PMC3064744/
Jazwinski SM, Kim S. Examination of the Dimensions of Biological Age. Front Genet [Internet]. 2019 [cited 2022 Jan 18];10(MAR). Available from: https://pubmed.ncbi.nlm.nih.gov/30972107/
Arbeev KG, Ukraintseva S V., Bagley O, Zhbannikov IY, Cohen AA, Kulminski AM, et al. “Physiological Dysregulation” as a Promising Measure of Robustness and Resilience in Studies of Aging and a New Indicator of Preclinical Disease. J Gerontol A Biol Sci Med Sci [Internet]. 2019 Mar 14 [cited 2022 Jan 18];74(4):462. Available from: /pmc/articles/ PMC6417443/
Jia L, Zhang W, Chen X. Common methods of biological age estimation. Clin Interv Aging [Internet]. 2017 May 11 [cited 2022 Jan 18];12:759–72. Available from: https://pubmed.ncbi.nlm.nih. gov/28546743/
Beltrán-Sánchez H, Palloni A, Huangfu Y, McEniry MC. Modeling biological age and its link with the aging process. PNAS Nexus [Internet]. 2022 Jul 1 [cited 2023 Jul 31];1(3). Available from: /pmc/articles/PMC9896935/
Husted KLS, Brink-Kjær A, Fogelstrøm M, Hulst P, Bleibach A, Henneberg KÅ, et al. A Model for Estimating Biological Age From Physiological Biomarkers of Healthy Aging: Cross-sectional Study. JMIR Aging. 2022 May;5(2):e35696.
Kwon D, Belsky DW. A toolkit for quantification of biological age from blood chemistry and organ function test data: BioAge. Geroscience [Internet]. 2021 Dec 1 [cited 2022 Jan 18];43(6):2795. Available from: /pmc/articles/PMC8602613/